The data composition system is intended for creating custom reports in 1C:Enterprise system. It consists of several major parts.
A data composition schema stores the source data for report composition, which includes data sets and data processing methods (fig. 13.2).
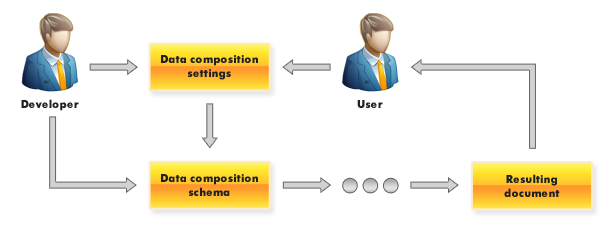
Fig. 13.2. General data composition system flowchart
A developer creates a data composition schema, which includes the query text, data sets and connections between them, available fields, data access parameters, and also default composition settings, such as report structure or data appearance template.
For example, a composition schema can include a data set as shown in fig. 13.3.
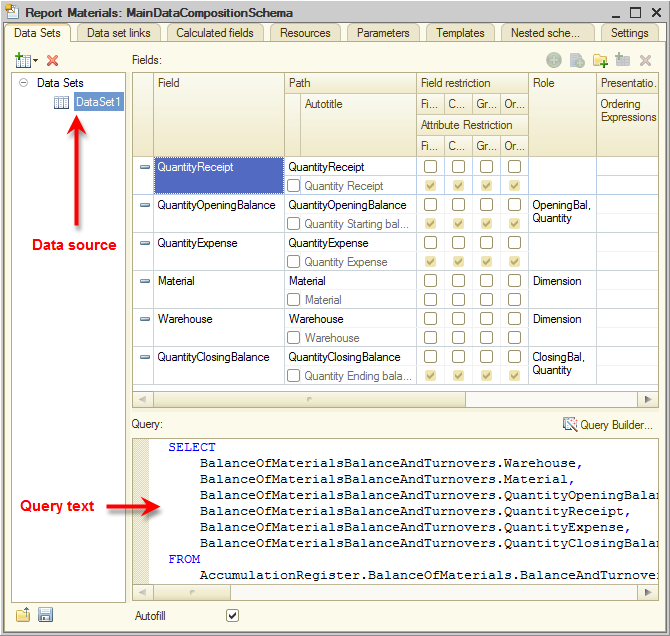
Fig. 13.3. Sample composition schema (a data set and a query that uses the set)
The figure shows the data composition schema wizard window, which contains the data source, the query text, and the fields selected by the query.
When a user runs a report based on the data composition system, what they get is not simply a table of records that satisfy the query conditions. A composition system report has a complex hierarchical structure, which can include a variety of items: groupings, tables, charts, and more.
A user can edit the report structure or create an entirely new report structure. A user can also customize the selection used in the report and the appearance of report structure items, view details of each item, and more.
For example, a report structure can include a single table and a single chart, as shown in fig. 13.4.
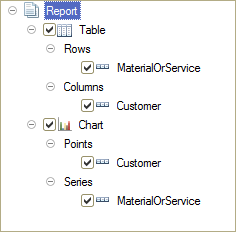
Fig. 13.4. Sample report structure
In this case the generated report looks as shown in fig. 13.5.
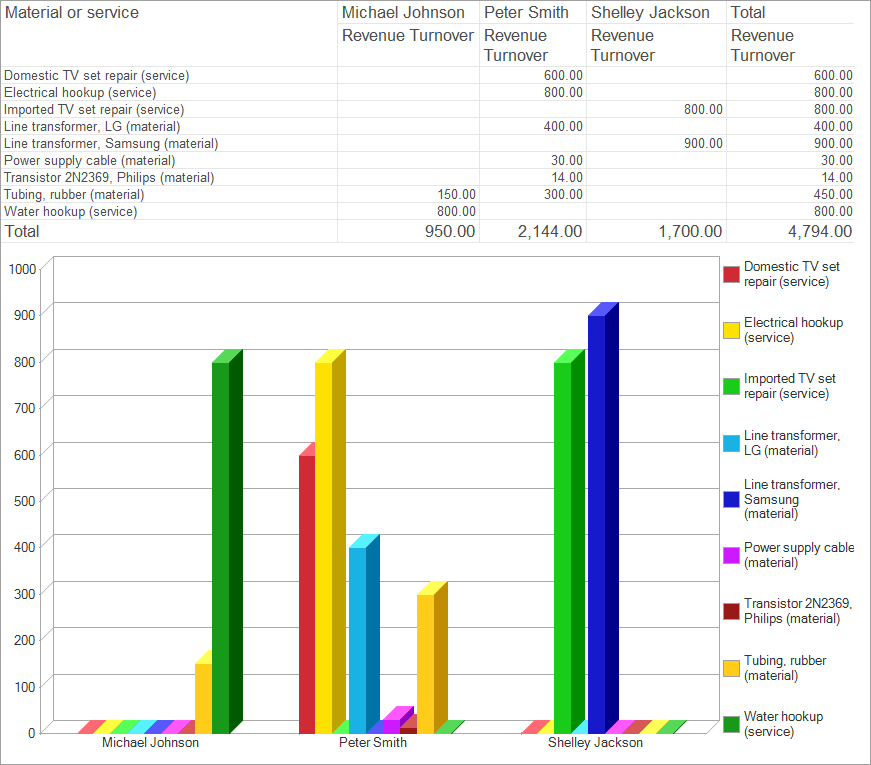
Fig. 13.5. Sample report
The sample report contains customer and service data from the SalesTurnover accumulation register, which is displayed as a table and as a chart.
As we have mentioned earlier, the data composition system is an aggregate of multiple objects. When a user runs a report, data is transferred consecutively from one data composition system object to another until the resulting report (a document displayed to the user) is generated.
The interaction between the objects is based on the following algorithm:
- A developer creates a data composition schema and the default settings. Usually a single data composition schema can serve as a basis for a large variety of reports, while data composition settings (either created by a developer or modified by a user) define the report layout.
- The template composer creates a template based on the composition schema and available settings. This step is a preparation for report execution. A data composition template is a complete assignment for the composition processor. It includes the required queries, report area templates, and more.
- The data composition processor selects data from the infobase based on the composition template, then aggregates and arranges that data.
- The output processor processes the composition result and the user obtains the resulting spreadsheet document.
This algorithm can be presented as a flowchart (fig. 13.6).
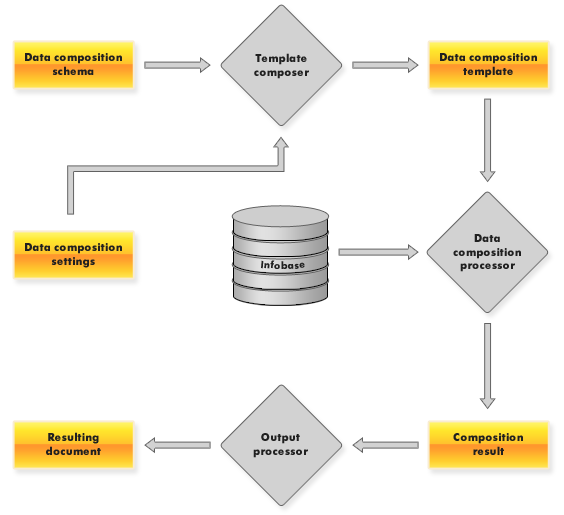
Fig. 13.6. Flowchart of composition system operations
Next page: Selecting data from a single table