Let us check the report.
- Run 1C:Enterprise in the debug mode.
- In the Payroll section, on the Reports menu, click Revenue by technician.
- Click Select variant (fig. 13.83).
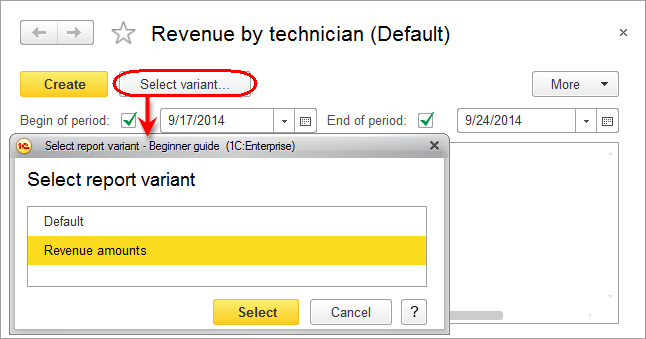
Fig. 13.83. Specifying report option
The Select report variant window contains two options: Default and Revenue amounts (which you have just created). - Click Revenue amounts and click Select.
- Click Create (fig. 13.84).
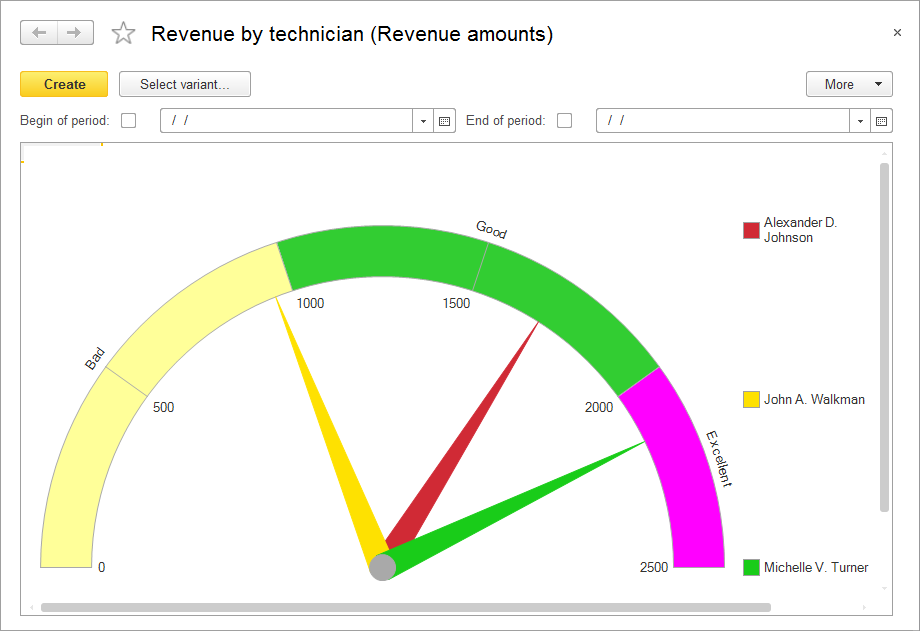
Fig. 13.84. Resulting report
This report option displays the same data as the default option but arranged as a gauge. The chart clearly displays the share of each technician in the entire revenue volume. Tooltips are available when you move the pointer over chart arrows.
Note that you have not specified the report period here, thus including all service-related data to the report. In a live system the number of documents is much greater than three, that is why you need the option to set the report period. For example, one might want to view monthly technician revenues.
But if you need to view data for a specific technician broken down by days and customers, it is sufficient to select the Default report option and generate the report.
In the Revenue by technician report development exercise you learned how to create and use report options to display technician performance data using the view that suits your needs best.
Next page: Getting current values from a periodic information register