Let us create a Gantt chart.
- Create a report configuration object named AccrualsChart.
This report is not based on a data composition schema. Instead, you will create a default report form and then generate the Gantt chart and specify its settings using 1C:Enterprise script. - In the configuration object editor for the AccrualsChart report, on the Forms tab, in the Report form field, click the Open
 button and create the default report form.
The upper right pane of the form editor (the Attributes tab) lists the form attributes. The default form attribute (Report) is created automatically upon form creation. - Click the Add attribute
 button to add a form attribute. Enter GanttChart as a name and select GanttChart as its type (fig. 18.36).
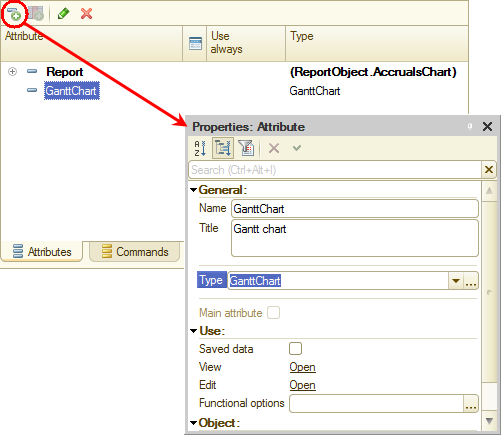
Fig. 18.36. Adding a form attribute - Drag the new attribute to the form controls pane.
Before you perform this step, the controls pane is empty. Once you drag the attribute, a Gantt chart field is added to the form preview pane (fig. 18.37).
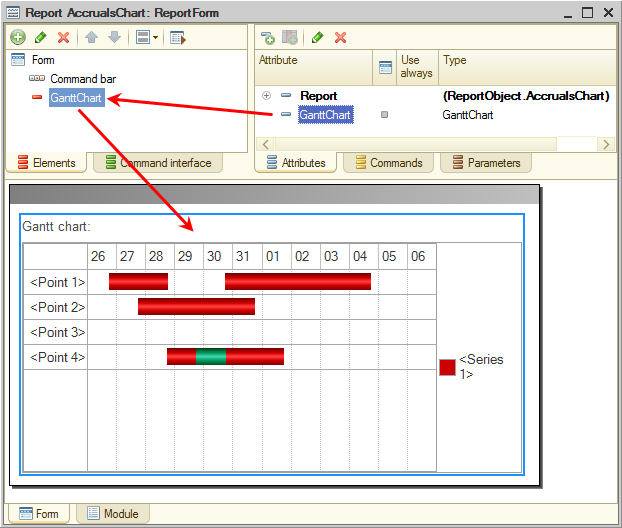
Fig. 18.37. Adding a Gantt chart to a form - On the Commands tab, create the Create command (fig. 18.38).
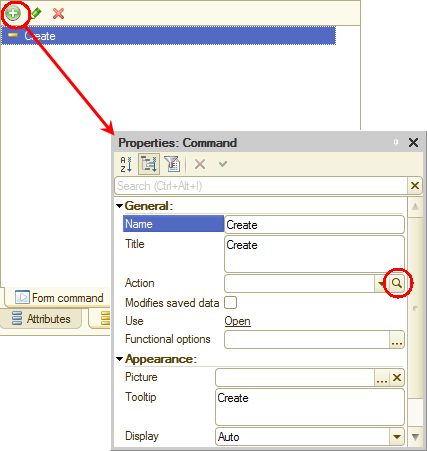
Fig. 18.38. Adding a form command
Let us specify the action for this command. - In the Action field, click the Open button.
- Click Create on client and a procedure on server (no context) (fig. 18.39) and then click OK.
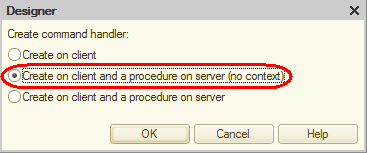
Fig. 18.39. Selecting form command handler type
This adds two procedure templates to the form module: the client Create() procedure and the server out-of-context CreateAtServer() procedure that is called from the Create() procedure.
We will skip the definition of a server out-of-context procedure in this tutorial, only mentioning that their execution is faster because they do not require passing the entire form context from the client to the server.
However, you have to pass the reference to the GanttChart form item as a parameter to the CreateAtServer() procedure to have it filled with data on the server side. - Change the module script as shown in listing 18.10.
Listing 18.10. CreateAtServer() procedure
&AtServerNoContext
Procedure CreateAtServer(Chart)
	// Insert handler contents.
EndProcedure

&AtClient
Procedure Create(Command)
	CreateAtServer(GanttChart);
EndProcedure
- Add a query template to the CreateAtServer() procedure (listing 18.11).
Listing 18.11. CreateAtServer() procedure
&AtServerNoContext Procedure CreateAtServer(Chart) Query = New Query; Query.Text=""; EndProcedure - Right-click between the quotation marks, click Query Builder, and confirm that you want to create a query.
- Select the Accruals.ActualActionPeriod virtual register table as the data source.
- Select the following fields from this table (fig. 18.40):
- Employee
- CalculationType
- BegOfActionPeriod
- EndOfActionPeriod
- Result
- Recorder
- Recorder.Presentation
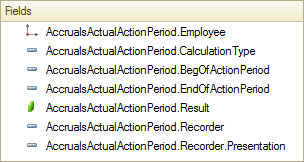
Fig. 18.40. Fields selected for the query
This completes the query creation. - Click OK and add the following script after the query (listing 18.12).
Listing 18.12. CreateAtServer() procedure
&AtServerNoContext
Procedure CreateAtServer(Chart)

    Query = New Query;
    Query.Text=
        "SELECT
        |    AccrualsActualActionPeriod.Employee,
        |    AccrualsActualActionPeriod.CalculationType,
        |    AccrualsActualActionPeriod.BegOfActionPeriod,
        |    AccrualsActualActionPeriod.EndOfActionPeriod,
        |    AccrualsActualActionPeriod.Result,
        |    AccrualsActualActionPeriod.Recorder,
        |    AccrualsActualActionPeriod.Recorder.Presentation
        |FROM
        |    CalculationRegister.Accruals.ActualActionPeriod AS AccrualsActualActionPeriod";

    SelectionResult = Query.Execute().Select();

    // Prohibiting chart updates
    Chart.RefreshEnabled = False;

    Chart.Clear();
    Chart.ShowTitle = False;

    // Filling chart
    While SelectionResult.Next() Do

        // Getting series, point, and value
        CurSeries = Chart.SetSeries(SelectionResult.CalculationType);
        CurPoint = Chart.SetPoint(SelectionResult.Employee);
        CurValue = Chart.GetValue (CurPoint, CurSeries);

        // Creating intervals within a value
        CurInterval = CurValue.Add();
        CurInterval.Begin = SelectionResult.BegOfActionPeriod;
        CurInterval.End = SelectionResult.EndOfActionPeriod;
        CurInterval.Text = SelectionResult.RecorderPresentation;
        CurInterval.Details = SelectionResult.Recorder;

    EndDo;

    // Setting series colors
    For Each Series in Chart.Series Do
        If Series.Value = ChartsOfCalculationTypes.MainAccruals.Salary Then
            Series.Color = WebColors.Yellow;

        ElsIf Series.Value = ChartsOfCalculationTypes.MainAccruals.Bonus Then
            Series.Color = WebColors.Green;

        ElsIf Series.Value = ChartsOfCalculationTypes.MainAccruals.Absence Then
            Series.Color = WebColors.Red;

        EndIf;

    EndDo;

    // Allowing chart updates
    Chart.RefreshEnabled = True;

EndProcedure
First, the procedure prohibits chart updates for the period of filling it with data. You need this so that you do not end up with a recalculation for every change to the chart data. Once the chart is filled, the procedure enables updates, and all of the recalculations are performed at once.
In the query selection search loop the chart is filled.
The SetSeries() and SetPoint() methods get either current or new points and series. Points and series are uniquely identified by their values (employee and calculation type obtained by the query).
After that, as a point and series are obtained, the GetValue() method obtains respective chart values.
Then a new interval is added to the chart. Its beginning and end are specified, as well as the interval text, which is displayed when you move the mouse pointer over the interval, and the interval details, which are displayed when you double-click the interval.
Once all the chart values are generated, the fill color is assigned for each series. The chart series represent a collection of values, which are iterated using the For Each … Do statement.
Let us return to the form and add the button that runs the Create command. - Drag the Create command from the Form command pane to the form controls pane (fig. 18.41).
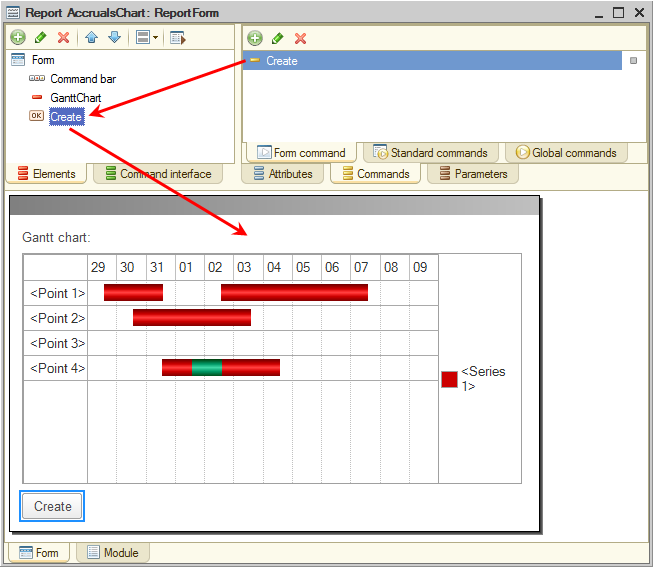
Fig. 18.41. Adding a button to a form - In the editor of the AccrualsChart report configuration object, click the Subsystems tab.
- Include the report in the Payroll subsystem.