1C:Analytics. Connecting Distributed Data Sources
Disclaimer: everything described in this article applies to 1C:Analytics version 1.85.3 and 1C:Enterprise platform version 8.3.27.1508.
Quick Recap
In the previous articles, we covered the core capabilities of 1C:Analytics. We built reports from a single 1C infobase, combined data from multiple registers using additional data sources, and assembled everything into an interactive dashboard linked to live 1C documents.
Throughout all of that, we assumed one important thing: all the data came from a single infobase.
In real projects, that assumption rarely lasts long.
Consider a common scenario: a company grows and opens branches in other cities, or even other countries. Each branch keeps its books in a separate 1C application. Or perhaps we have a large holding company with several subsidiaries, and leadership wants consolidated numbers across the entire group.
At that point, the analytical task outgrows a single infobase. We need a way to bring data from multiple sources together.
So here is the practical question: how do we build management reporting when the data lives in different places, such as external SQL databases, separate 1C applications, or both?
This article covers two approaches:
-
Using the External Data Source object inside the 1C configuration.
-
Connecting multiple 1C infobases directly in 1C:Analytics and combining their data.
Approach 1: External Data Sources in 1C
The idea behind this approach is simple. Our 1C infobase becomes the central hub, the single point from which 1C:Analytics pulls all data. We connect outside databases to 1C by using the External Data Source configuration object, and their tables become available for queries, reports, and analytics just like any native 1C object.
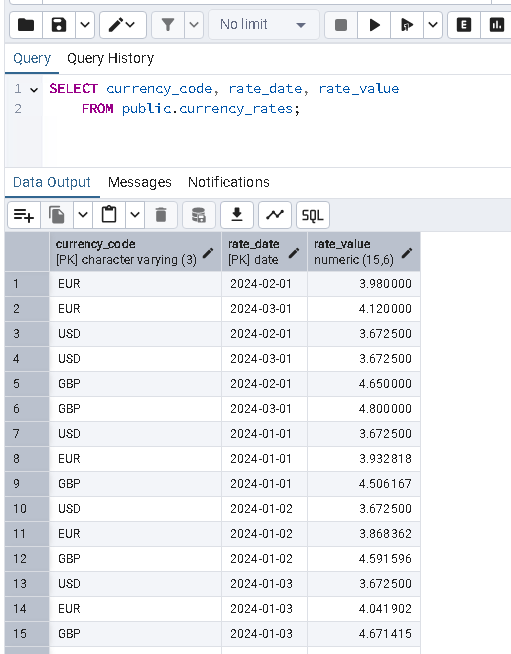
Let's walk through a simplified example. Suppose we have an external PostgreSQL database with a table called "currency_rates":
- currency_code: currency code;
- rate_date: exchange rate date;
- rate_value: exchange rate value.
We want to build a chart in 1C:Analytics that shows exchange rate data from this table.
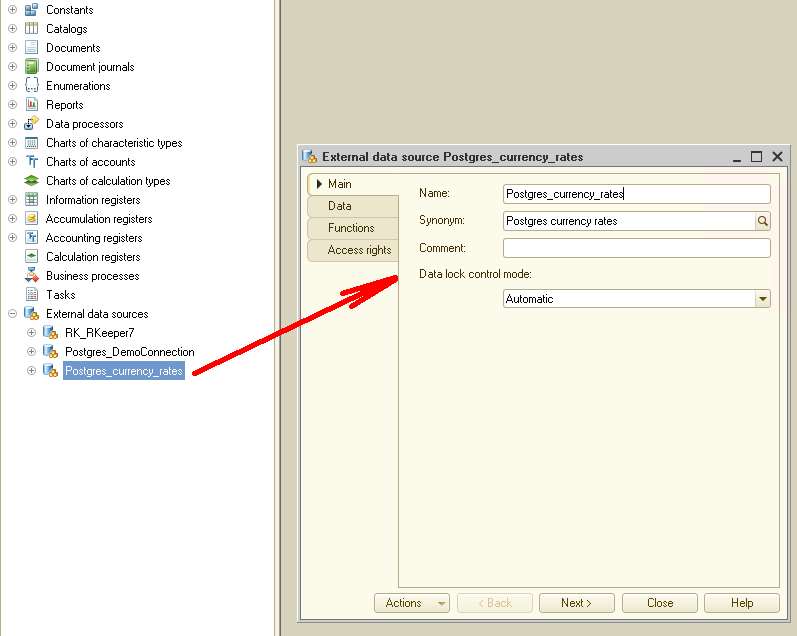
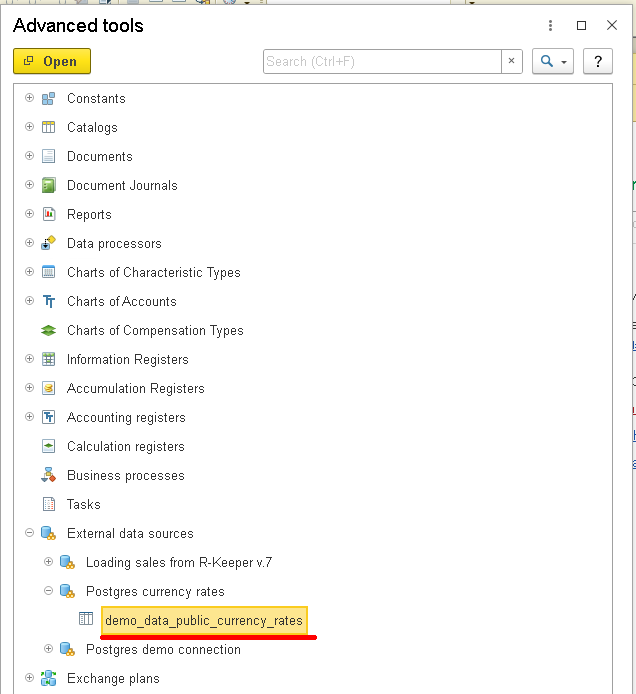
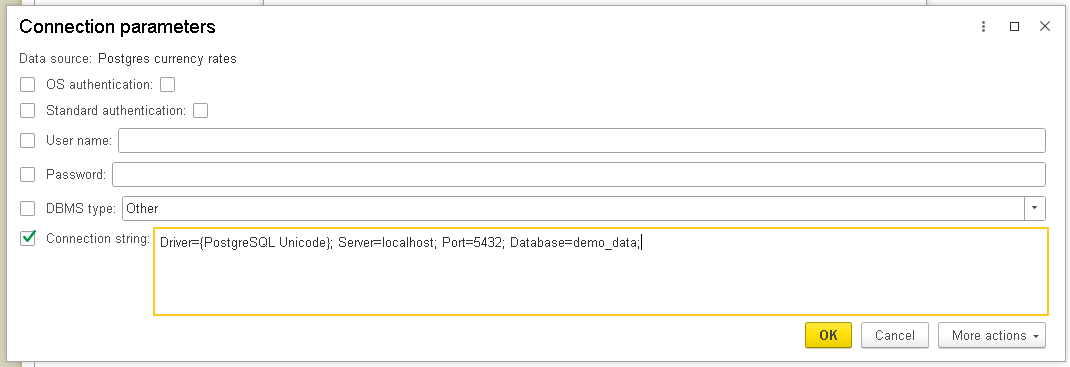
Open 1C in Designer mode, add an External Data Source object, and set up the connection to the PostgreSQL server:
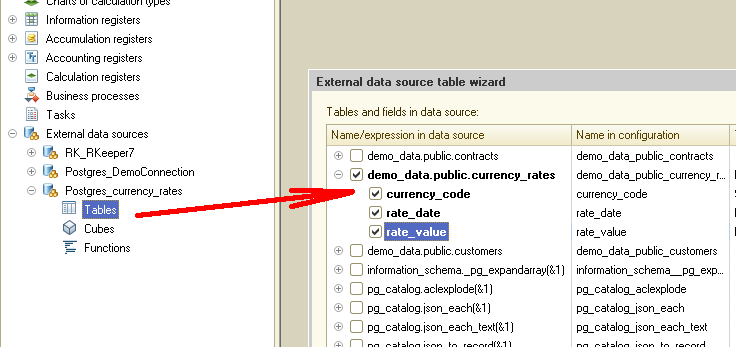
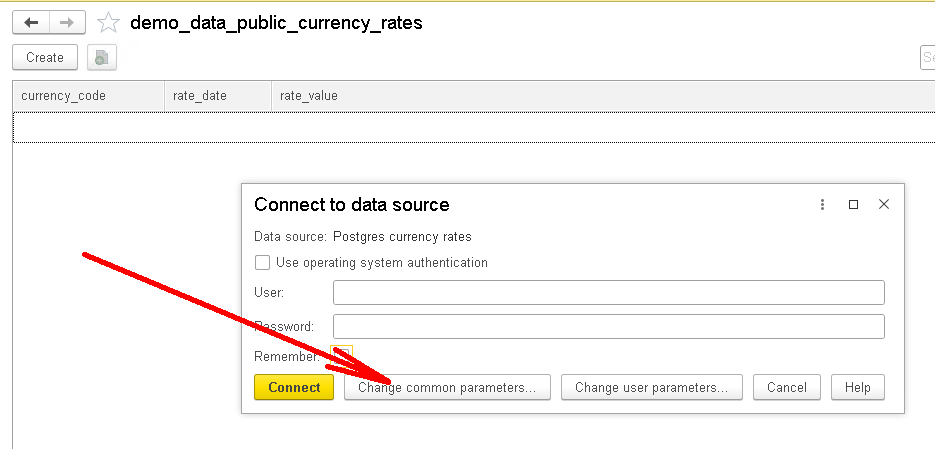
Once the connection test passes, add the currency rates table to the source:
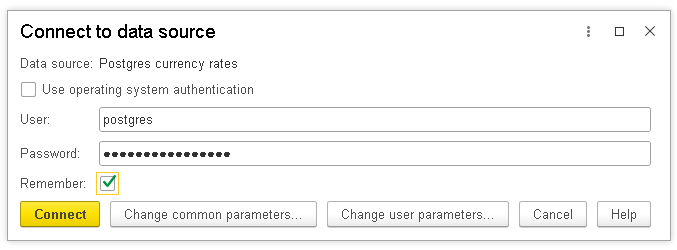
Update the configuration and launch 1C in 1C:Enterprise mode. Note: the first time we access data from an external source, we'll need to enter the database connection credentials. This is a one-time step. After that, it works automatically:
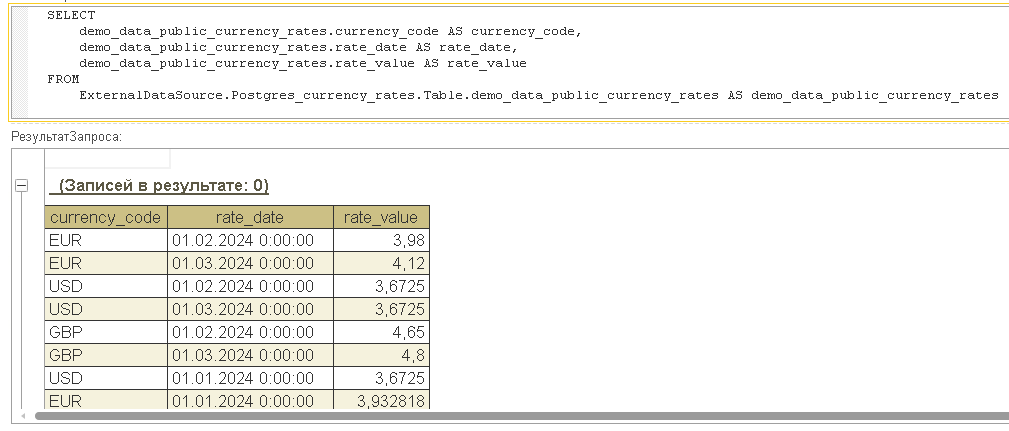
With the connection in place, we can already view the data inside 1C. For example, through the query console:
Now let's switch to 1C:Analytics and try to use this data there. If we go ahead and create a chart right away, we'll notice it doesn't work:
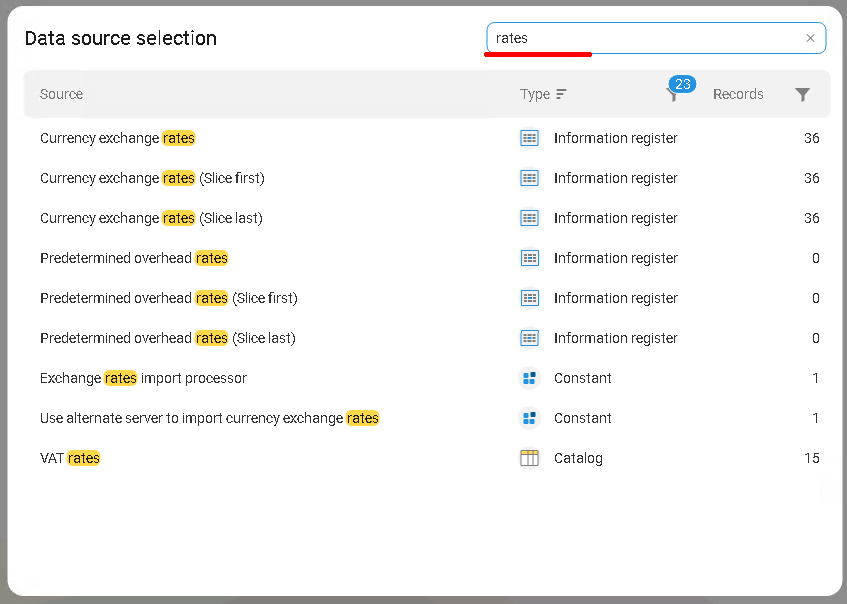
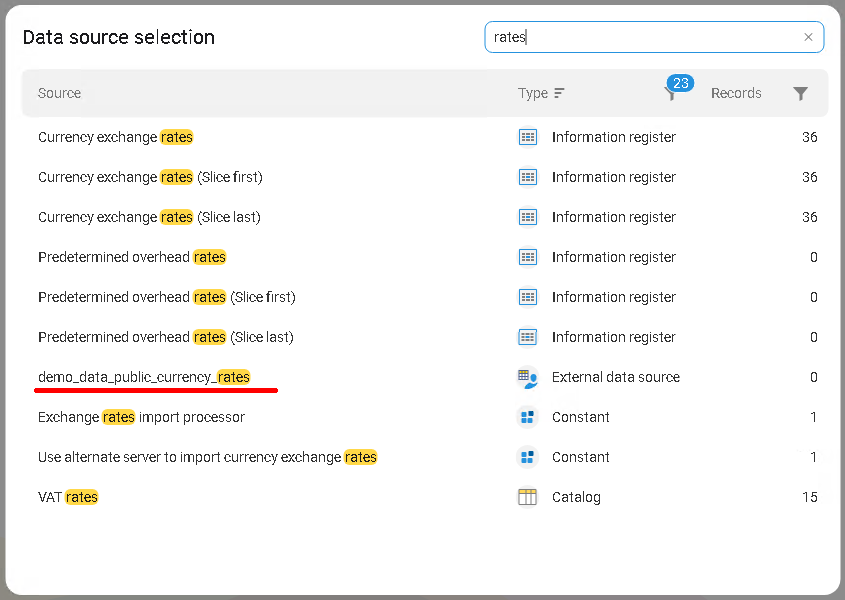
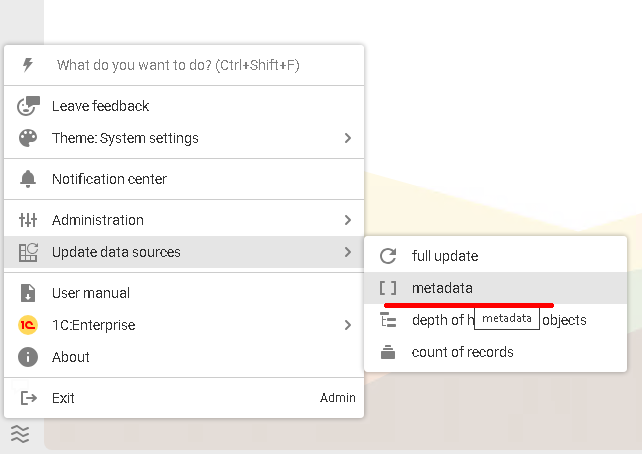
1C:Analytics doesn't see the new external source yet. The fix is straightforward: update metadata. Once the update completes, Analytics picks up the new object:

The external source is now available:
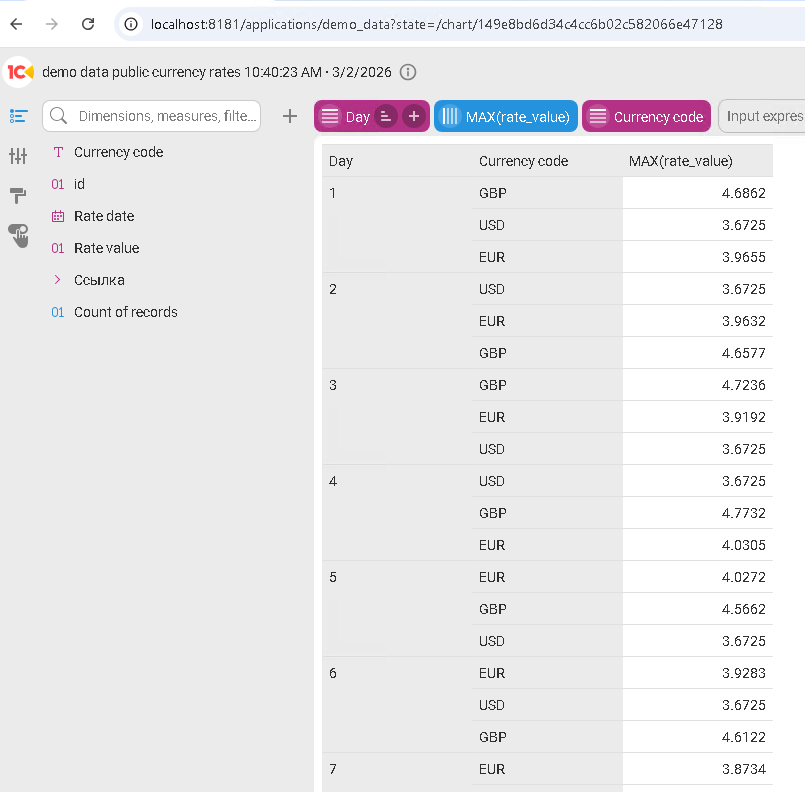
Create a new chart, select the source, and build a table of exchange rate changes:
From the BI system's perspective, this setup still looks like a single 1C source. That is its main advantage. 1C acts as the integration hub; 1C:Analytics talks only to 1C and gets a unified data model in return.
That said, this approach has a few significant limitations.
Configuration changes required. Adding an external source means modifying the 1C configuration (or at least creating a configuration extension). That's not always practical, especially for production systems with strict change-management policies.
Direct database access required. You need network access to the external database. In some organizations, security policies make this impossible.
Performance. This is the biggest concern. External data sources in 1C rely on external drivers (such as ODBC), which can become a bottleneck. BI systems exist specifically to handle large data volumes, and at scale, this approach may not deliver the speed we need.
Approach 2: Connecting Multiple 1C Infobases in Analytics
That would be a good place to stop, except there is one more capability worth covering. Starting with version 1.72.2, 1C:Analytics can connect to multiple 1C infobases at the same time and combine their data on shared dashboards. We can build a single dashboard that shows sales from one 1C application alongside sales from another.
The reporting workflow is essentially the same as before. Let's walk through it.
Suppose we have two different 1C configurations. The first is the 1C:Drive instance we've been using throughout this series. The second is 1C:AccountingSuite, populated with its own test data.
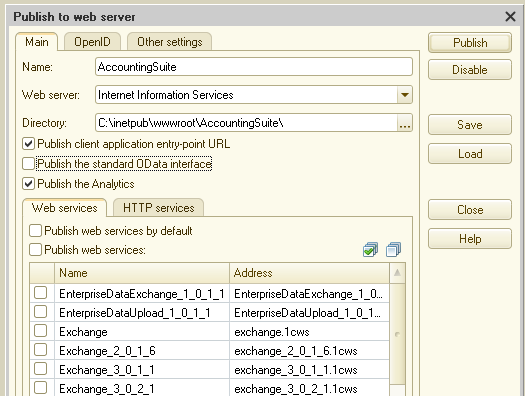
We already published the first infobase on a web server. Now we need to do the same for the second one so that 1C:Analytics can access it.
Publish the second 1C application:
Go to the 1C:Analytics control panel and create a new application. Enter the web publication address of the first infobase:
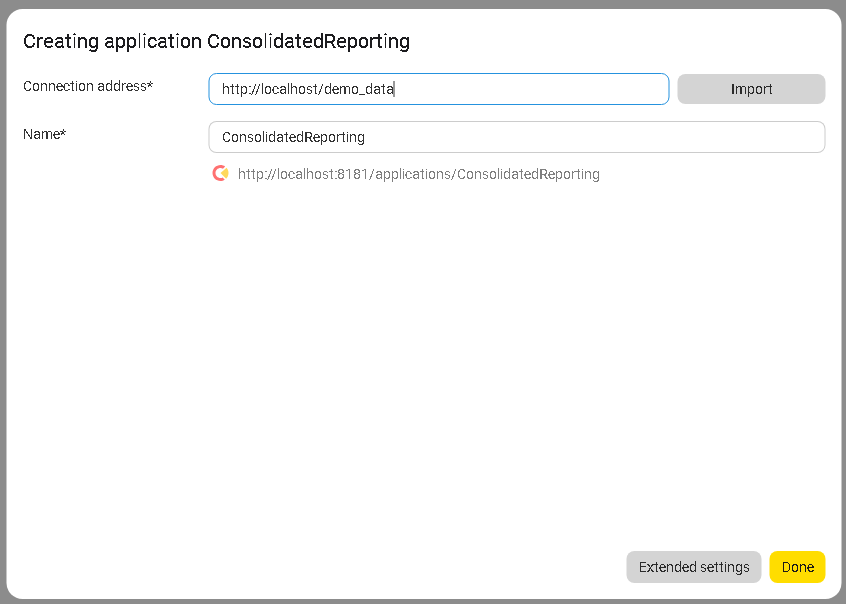
This time, don't click Done just yet. Click Extended settings instead:
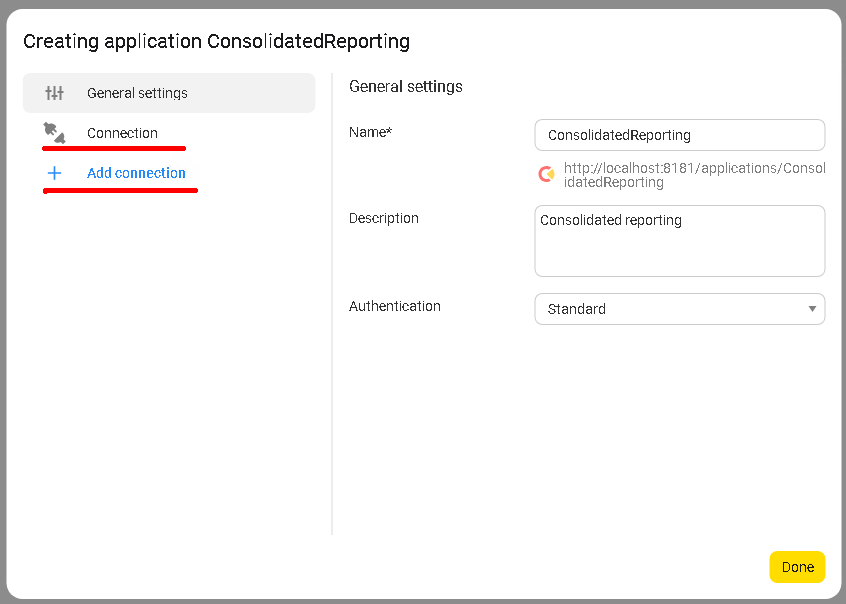
Two things matter in the form that opens: the Connection tab and the Add connection button.
Open the Connection tab:
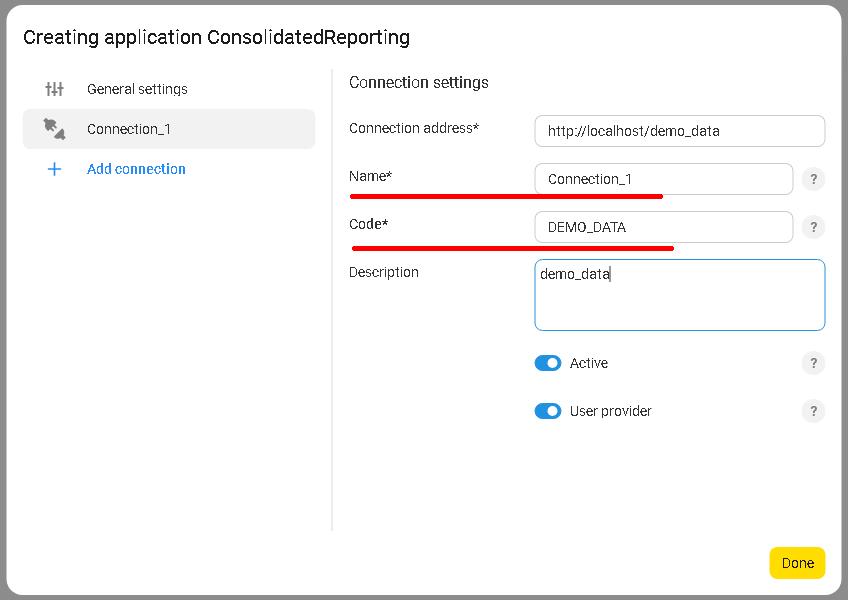
This tab shows the parameters for the current connection to http://localhost/demo_data. Give it a clear, descriptive name. Pay special attention to the Code field. It's empty by default, and we need to fill it in with a meaningful value. Important: once saved, the Code can no longer be changed.
Don't save yet. Click Add connection:
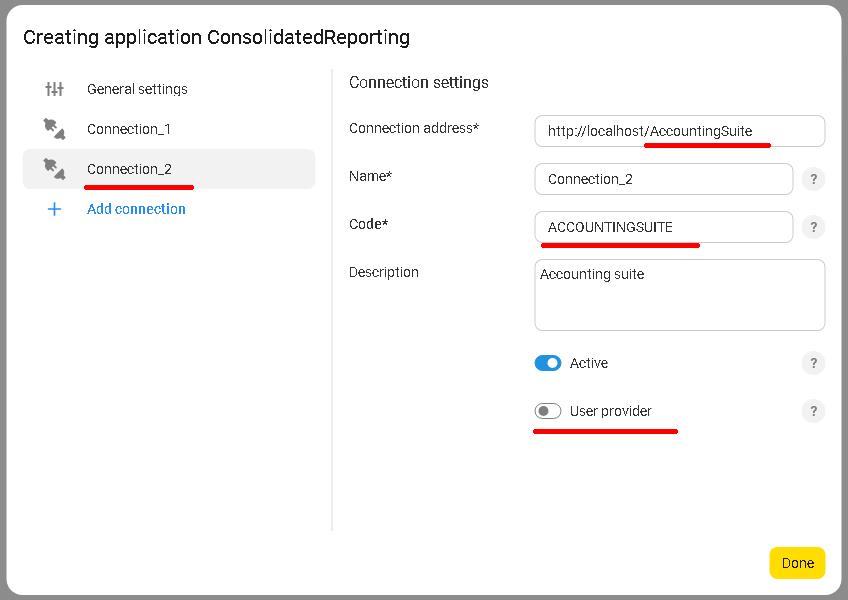
A second connection form opens. Enter the address of the other 1C infobase in the Connection address field and fill in the Code.
Notice that the User provider switch is disabled here. On the previous connection, it was enabled. What does this setting do?
1C:Analytics authenticates against each connected infobase using a 1C username and password. When we connect multiple infobases, one of them acts as the user provider. It handles authentication for all the others, regardless of how many connections we add.
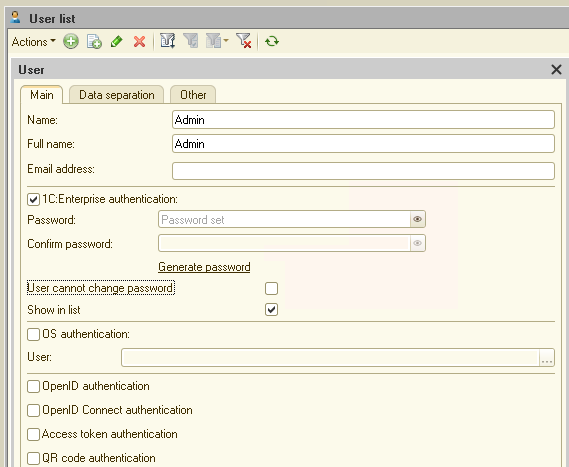
This creates an important limitation in the current version: all connected infobases must share the same user account (same username, same password) with read access to the relevant registers and catalogs in each one.
In our example, that shared account is Admin, which we created in both infobases ahead of time:
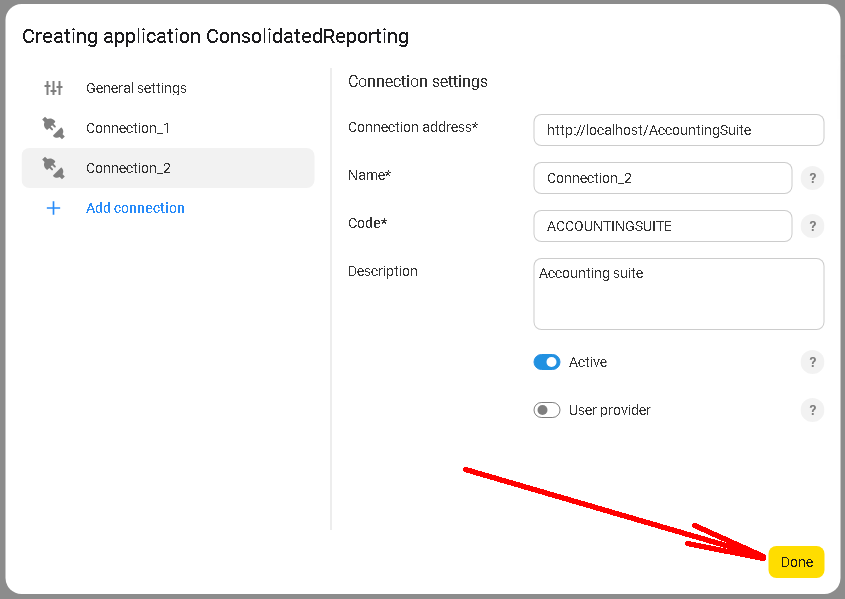
With the user setup in place, go back to the 1C:Analytics control panel. Everything is ready. Click Done:
The new application now shows two connections, one for each 1C infobase:
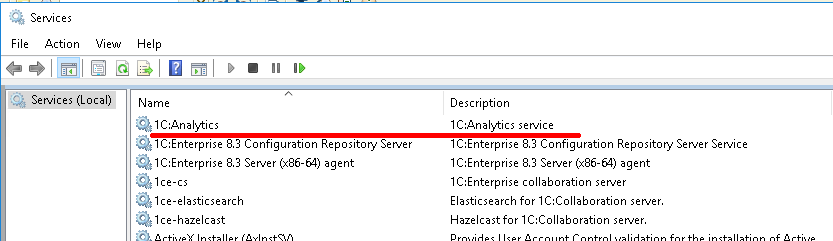
Before moving on, I strongly recommend restarting the 1C:Analytics service:
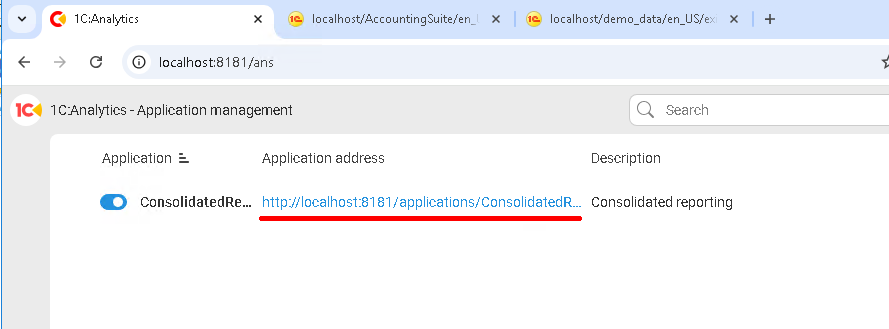
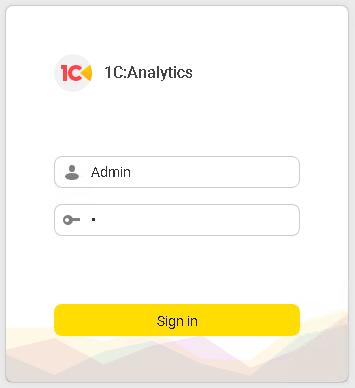
After the restart, open http://localhost:8181/applications/ConsolidatedReporting. The system asks for a 1C login. Enter the credentials of the shared user. In our case, that is Admin:
Once logged in, update metadata so the system discovers all available data objects:
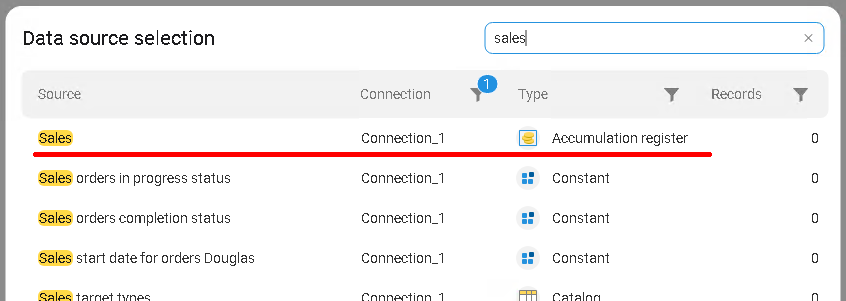
Now click Create to start a new chart. The source selection form looks different this time:
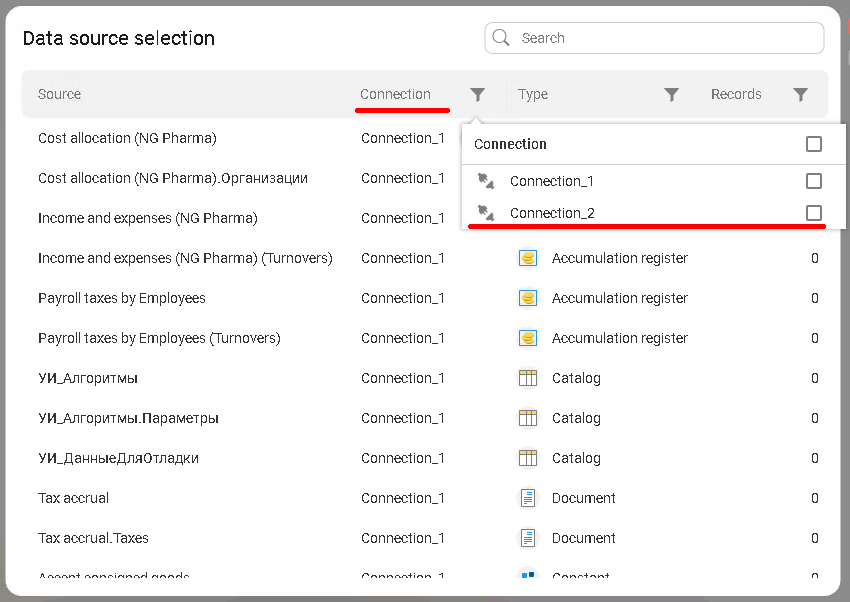
There is a new Connection column. We can now select data from any of the connected infobases.
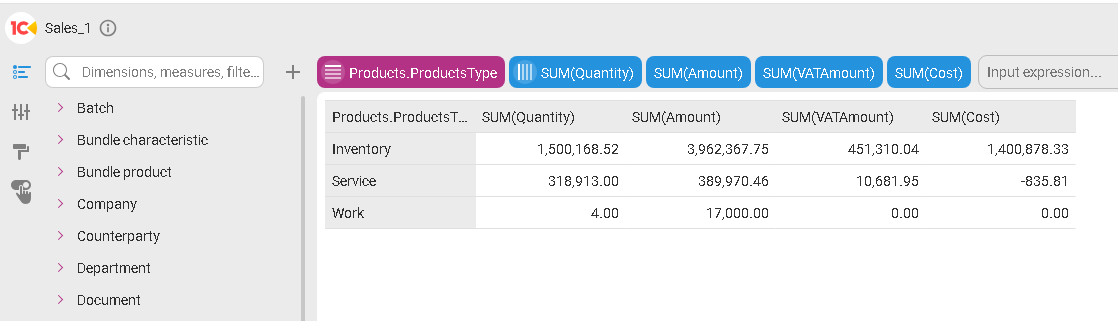
Let's create two charts, one showing sales from each infobase, and place them on a shared dashboard.
First chart:
Second chart:

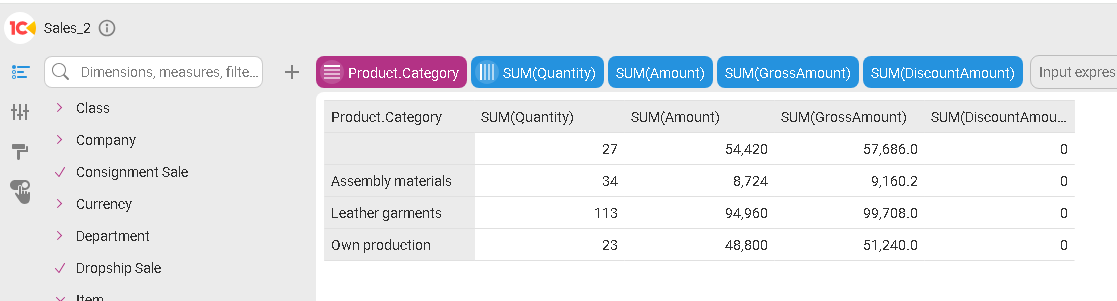
Notice that the register is called Sales in one infobase and Sales Analytics in the other. This is a clear sign that we're combining data from two completely different sources.
Create a new dashboard and place both charts on it:
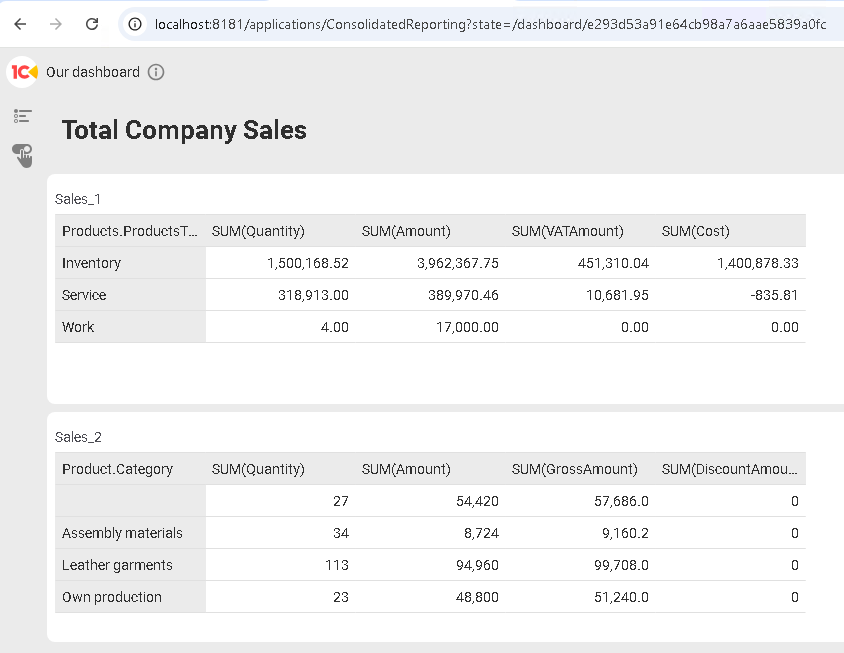
This example is intentionally simple, but it shows exactly how to build consolidated reporting across multiple 1C applications using 1C:Analytics.
Summary
In this article, we looked at two ways to handle distributed data in 1C:Analytics. The first approach uses External Data Source objects inside the 1C configuration to connect outside databases, such as PostgreSQL. This makes 1C the central integration hub, but comes with limitations around configuration changes, database access, and performance. The second approach connects multiple 1C infobases directly in 1C:Analytics, making it possible to build shared dashboards across several applications. This requires a shared user account across all connected infobases, but does not require any configuration changes.
Both approaches extend 1C:Analytics well beyond a single-infobase setup and open the door to enterprise-level consolidated reporting.
What's Next
There is one topic we haven't addressed yet: performance.
When we're building a system for thousands of concurrent users who generate millions of records every day, speed becomes critical. How do we make sure the BI layer performs well under heavy load without slowing down the main 1C application?
We'll answer that in the next article, where we'll look at database copy mechanisms and the Data Accelerator.

Writen by
1C Developer
20+ years of experience in the software industry in Russia, UAE and Germany. My main fields of expertise are developing and implementation of business applications (Retail, CRM, WMS, and Accounting) and integration of software with POS equipment and web portals.


