How We Analyze Memory Usage by Native Applications

How We Analyze Memory Usage by Native Applications (C++, Windows, Linux)
1C:Enterprise technology platform is a large-scale software (over 10 million code strings in С++, not to mention Java and JavaScript). Read more about the platform here.
While running solutions created on the 1C:Enterprise platform, we occasionally observed scenarios where memory usage by the platform processes seemed excessive. Unfortunately, when dealing with such a large application, there was no simple way to determine whether the memory consumption was indeed excessive. So, we started looking for specialized tools that would help us analyze memory usage by the applications.
Below is a report on what tools we tried out, why they didn't work for us, and how we finally resolved the task of analyzing memory usage.
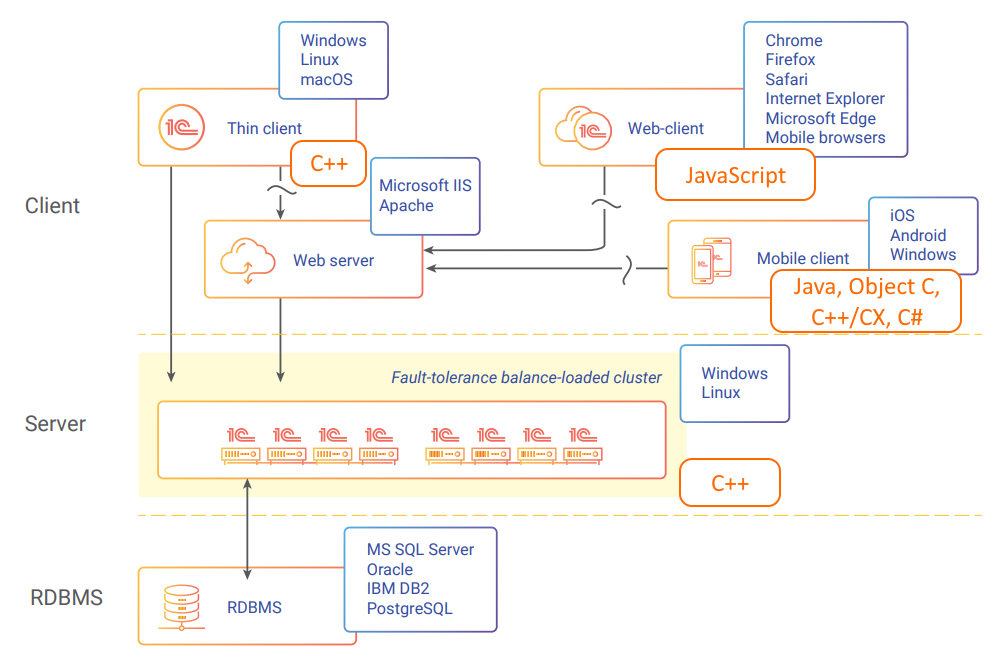
1C:Enterprise Architectural Diagram with Component Development Languages
As shown in the diagram, the most resource-intensive part of the platform is the 1C server cluster, where the main business logic is executed. These are native applications coded in C++ and running on Windows and Linux. So, the task can be defined as follows: we need a tool to analyze memory usage by native applications running on Windows and Linux.
Why Memory "Leaks" Occur and How to Deal with Them
A typical source of excessive memory usage is memory leaks and inefficient algorithms that lead to memory fragmentation and over-allocation.
Many C++ developers face such issues, so there are quite a few tools available, for example:
These tools have fundamentally different operating principles. Thus, sanitizers, such as AddressSanitizerLeakSanitizer, can add additional markers around memory allocations and, therefore, catch out-of-bounds memory accesses and other issues. On the positive side, this approach has a negligible impact on the application's running speed. On the negative side, this approach is intrusive (additional instructions are inserted into the executable code) and is unacceptable for release builds. However, it is well suited for the development stage.

Another well-known tool that is also unique engineering-wise is Valgrind. It executes the tested application's code in a sandbox on a virtual processor while collecting many metrics. At the same time, Valgrind slows down the application considerably (sometimes by orders of magnitude), making it impossible to use not only in production but often even in the development and debugging process.
There are tools inspired by Valgrind but developed with the idea of minimal impact on the performance of the profiled application. These include HeapTrack from KDE. The downside of HeapTrack is that it is tied to a specific operating system. Moreover, some memory profiling tools are linked not only to a particular OS but also to a specific allocator, such as the pprof tool, which is part of the gperftools toolkit developed by Google and primarily intended for use with the tcmalloc allocator.
You can find a lot of open-source solutions on GitHub, but unfortunately, they weren't suitable for us due to some requirements we had.
Due to the specifics of running business applications, one of our essential requirements was the ease of data collection in a real-life end-user environment. If a user (or their administrator) suspects that an application uses too much memory—there should be an easy way to gather the information that we need as platform developers.
So, here are our requirements for the tool:
- Easy post-mortem analysis. The app user does not have an analytics tool and is unaware of it. The user only sends us a dump that we analyze using the tool. Obtaining a memory dump is a relatively simple task, and we can easily delegate it to a system administrator on the client's side.
- The tool does not impact the applications (it does not link anything extra to the application in release builds).
- It does not increase resource consumption by the application.
- The tool can analyze the existing versions of applications (compiled before the tool was implemented).
- The tool shows the address where objects are located in the dump memory (with the option to obtain the object type).
- The tool can run under Windows and Linux.
When it became evident that no suitable solution was on the market, we started developing our memory usage analysis tool.
Approaching the issue of memory analyzer development, we divided this task into four stages:
- Determination of allocation addresses and sizes
- Determination of object types
- Finding relationships between allocations
- Analysis of collected data
Determination of Allocation Addresses and Sizes
The first step in analyzing memory consumption is determining the addresses and sizes of the allocations within a memory dump. To do this, we use a very simple application:
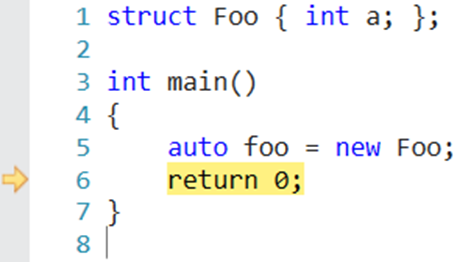
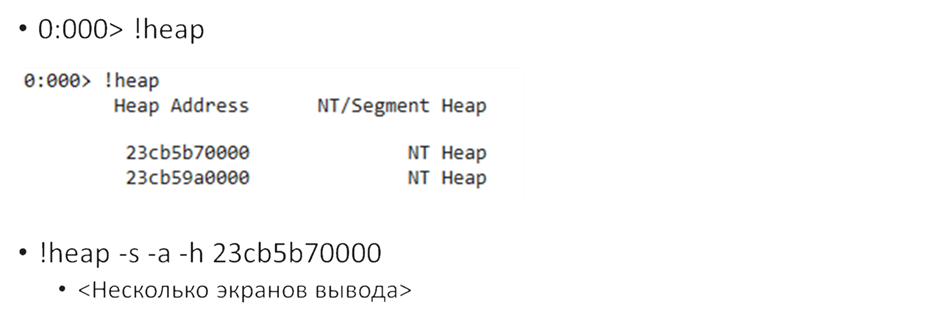
We compile it without optimization so that the compiler is guaranteed to create a new object in the heap. Next, we stop just before the return, take a dump, and note the address where our structure with saved variable foo is stored. We now need to figure out where the one and only allocation is. To do this, we open the dump with a debugger (WinDbg for Windows) and run the !heap command. This command displays the existing heap segments. We won't go into the details just now, but we will request more detailed information about the heap segment that contains the address of the foo variable.
In fact, we will get an output on several screens, but among this information, we will see that there is a LFH (Low-Fragmentation Heap) segment with this address:
This simple experiment proves that the information we need can be extracted from a memory dump
Now, the challenge is to do it through code without relying on WinDbg.
When finding allocations in Windows, the first thing we need to study is the book Windows Internals. The key points from this book that are important to succeed in our task are outlined below.
In current Windows editions, there are two system allocators:
- NT Heap
- Segment Heap
For the 1C:Enterprise platform, all allocations occur within the NT Heap. Segment Heap is used for applications created on the Universal Windows Platform (UWP) platform.
The allocation system is multi-layered. When we request memory from the OS kernel, memory is allocated to pages with a page size of 64 KB. This size is significantly larger than needed for the relatively simple structures we use most often. Therefore, we have a user space allocator, which is also divided into multiple levels:
- LFH (front-end)
- User space backend
- VirtualAlloc
The first one is front-end, aka Low Fragmentation Heap (LFH). This level is designed for small allocations of up to 16 KB; primarily, it allows optimizing memory allocation in cases where we use memory a lot and free it to avoid fragmentation.
If the allocation size exceeds 16 KB but falls within a certain upper bound (around 2 MB), then such allocations are also handled by the user space allocator, but at its second level. If we request a larger allocation, the app calls the OS kernel and invokes VirtualAlloc.
Since we have already established in the previous step that the debugger has access to the data we need, we are left with one question: how to obtain this data through code. To do this, we can use Debug Interface Access SDK, as well as the dbghelp library. To get allocator data, we need to analyze the heap structure. The NTDLL debugging symbols supplied by Microsoft contain information about this structure. Unfortunately, the book Windows Internals does not provide clear instructions on what exactly needs to be obtained from NTDLL.
Fortunately, allocator analysis is a popular topic at conferences and forums dedicated to information security, as attacks on allocators are a fairly common hacker attack scenario.
We used the research materials of the Black Hat conference, which describe in sufficient detail the information stored in the allocator structures. Based on this, we implemented a software algorithm for the Windows OS to extract information about allocations in the dump, including their size and addresses.
The task of finding allocations in dumps on the Linux OS was, on the one hand, easier because for Linux there is all the necessary documentation and source code of the OS in the open access. On the other hand, Linux has a ton of different allocators.
Naturally, if you take an application that uses glibc, it will likely use the ptmalloc allocator. However, without rebuilding the application, the allocator can be easily replaced with another one using the LD_PRELOAD environment variable.
Within the 1C:Enterprise technology platform, we have long recommended using the tcmalloc allocator developed by Google. However, up to the latest versions of the 1C:Enterprise, this allocator was not integrated into the platform and had to be connected using LD_PRELOAD.
When we worked on developing the memory usage analyzer, we immediately focused on this particular allocator, so our tool is not universal.
Determination of Object Types
Having determined the addresses and sizes of allocations, we can move on to the task of determining the types of objects that are located in these allocations.
Unlike Java or C#, C++ has no metadata. However, we have the typeid operator.
Let’s assume we wrote a simple program:
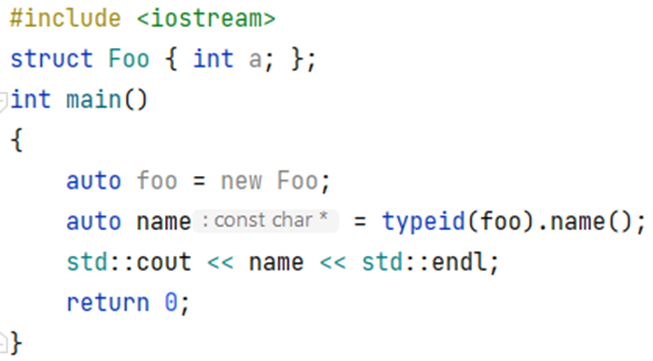
Here, we try to output the name of the type stored in variable foo. And it works!
It would seem this is the key to solving our problem. But the fact is that the Foo structure is a non-polymorphic type, and all information was obtained at the compilation stage and rigidly entered into the program. Therefore, we cannot apply this approach to analyzing the dump.
As for polymorphic objects, the situation is somewhat better. By default, for such allocations, there will be a pointer to information in the form of type_info at the beginning. It would seem that we could read the required data from there.
But, unfortunately, the 1C:Enterprise platform is historically built without Run-Time Type Information (RTTI), which means that, in our case, information about types will be absent in the dumps. It is one of many methods we can use.
After pointer type_info, a pointer to the virtual methods table is stored in memory. If we compare this data to the information available in the debugging symbols, we can understand what data type is stored in this allocation.
Moreover, due to the specifics of the 1C:Enterprise platform, we use a relatively large number of objects with dynamic polymorphism as root objects, which are called SCOM classes. This approach is similar in ideology to ATL. More details are available here in the SCOM section.
As mentioned above, to determine the type of an object by the value of a pointer to the virtual method table, we need debugging information. There are different mechanisms for reading debugging information in various OSes. In Windows, this is Debug Interface Access (DIA), and in Linux, it is libdwarf.
The downside of these solutions is their performance—both are extremely slow. Therefore, for our utility, we implemented a dedicated analysis stage that takes debug symbols and extracts the necessary information from them. Then, it is saved in a kind of intermediate format that is universal for both Windows and Linux.
Finding Relationships Between Allocations
The next step in the analyzer's work is to find relationships between allocations. Let’s assume we’ve discovered a memory leak when creating an object of a specific type. If this problematic object is a field (property) of another class, then for a complete investigation of the problem, it is necessary to understand the place where this parent class was created.
We’ve identified some of the allocations (let's call them root allocations). But these are by no means all allocations. To analyze the remaining memory in the dump, we can go through the properties of known objects and, if they contain references or pointers, use this information to expand our knowledge of the dump contents. Naturally, we will come across fields that have standard collections. For these, you can use an optimized approach to get element pointers based on the symbolic representation for the debugger (NatVis).
In the 1C:Enterprise platform, we often use our own implementations of collections and containers (for example, our own implementation of strings. This article has a detailed explanation of our string implementation). In order to avoid hard-coding the algorithms for traversing links to a specific application, we implemented this analysis step as a scriptable mechanism. The scripting language we chose to use was Lua.
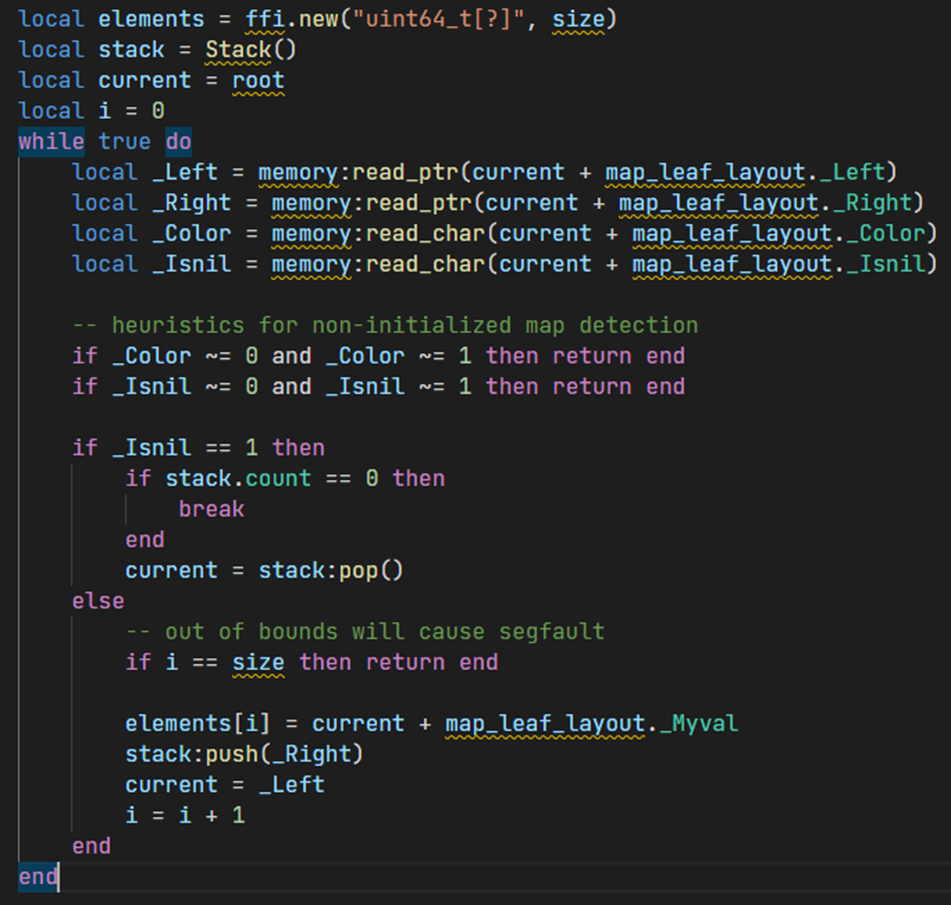
As a result, the scripts for traversing child allocations look as follows (in the example, we parse the elements of std::map).
This is how it is implemented in Lua:
And this is how the description of a similar structure looks like in NatVis:
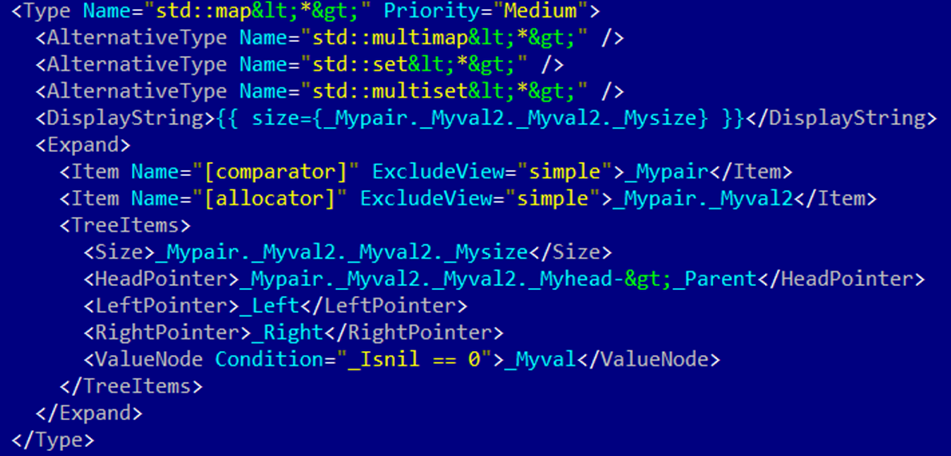
The difference here is that we have a relatively large number of additional checks because, unlike the debugger, which implements an "approximate" view of the collection's contents, we need to accurately determine that this allocation and the collection in it are valid. Therefore, for a map, we check the values of all fields, including those that are "insignificant" from the debugger's point of view. It is one of the reasons why we chose a scripting approach rather than a declarative one, as in NatVis.
Analysis of Collected Data
Once all the information about data allocation within the dump has been identified, we need to analyze it.
When faced with the task of analyzing data, the first thing that comes to mind is uploading data to a DBMS and running analytical queries.
It was exactly what we did by uploading the data in PostgreSQL DBMS. Why PostgreSQL and not a specialized columnar or graph DBMS? The fact is that after we considered what information we needed to get from the dump investigation, it turned out that, in most cases, it is covered by several relatively simple queries. And the overhead of putting data into specialized storage exceeds the execution time of these simple queries in PostgreSQL. Therefore, we have yet to come up with complex solutions here.
Also, there are several other mechanisms for analyzing collected data. For example, we can build link graphs between allocations, thus helping developers identify allocations that lead to the problematic memory areas and the objects related to these memory areas.
There is also a mechanism for data extraction. For example, you can extract all the contents of the strings inside the memory dump. Here is an example of how it works.
We have a relatively simple piece of software.

The application has structure Derived that inherits from structure Base. The structure Base is purely virtual, which is necessary for our target structure Derived to use dynamic polymorphism and store a pointer to the virtual method table. We are not interested in implementing the foo() method in this case.
Inside the structure Derived is a std::vector containing pointers to structures of type Foo. These structures do not have virtual functions. Next, a memory space is allocated in the heap for a structure of type Derived, and three elements as pointers to the structure of type Foo are placed inside the vector.
After that, we take a dump and call our analyzer. The analysis result:
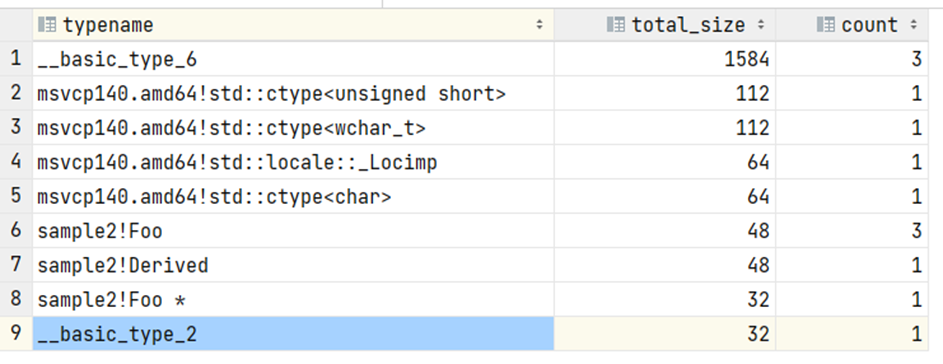
What can we see?
First, in addition to the expected Foo and Derived structures, we see additional information. These are some system/service structures that we are not interested in; in real-life dumps, they will be at the level of statistical error.
The remaining information corresponds to our expectations. We can see one object of type Derived, which consumes 48 bytes of memory. At that, we can identify its exact address (this information is not shown on the screen). Next, we have three objects of type Foo, which also corresponds to our expectations. There is also a pointer to an object of type Foo, which is the vector's body represented in a single instance.
We can also build a link graph between allocations. For example, if we need information about how we can get to one of the objects of type Foo, which is located at address 0x2a5b3b9e670, we will get the respective link graph (we use Graphviz to build graphs).
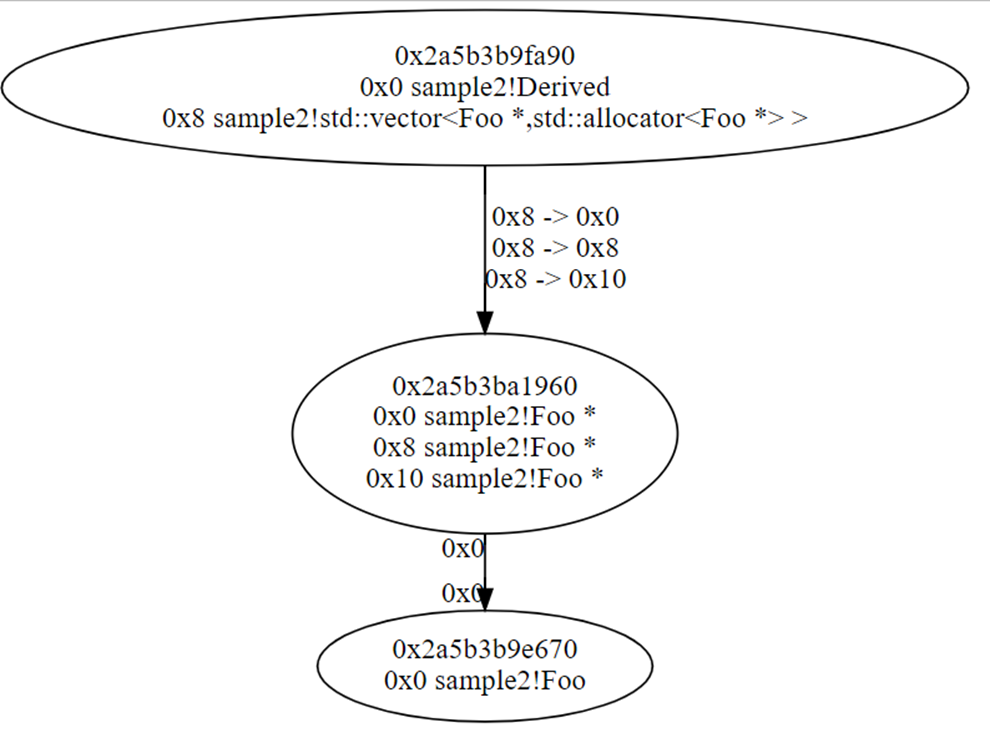
Read the graph from top to bottom. At address **fa90, we have a structure of type Derived.
Inside it, at offset 0x8, there is a std::vector of pointers to objects of type Foo. It has three links to the same memory area. It is the body of the vector where these pointers are stored. This memory space is located at ****1960; we use the first pointer to move from there to the element we are interested in.
Now, let's move on to real-world tasks!
Analyzing a dump of an actual platform process, such as a server cluster process rphost, is a rather resource-intensive task. Before our utility was optimized, the estimated time to analyze a 100 GB dump was several days. After optimization, the analysis time was reduced to two hours. It is with the assumption that the dump, which is about 100 GB in size, contains a correctly functioning platform process without any anomalies. What do we mean by anomalies? For example, we encountered a situation where the email library was creating a series of large allocations in sequence, as a result of which a 100 GB dump was 90% occupied by a small number of allocations and, therefore, could be investigated very quickly. However, this example is a rare case.
As a rule, the memory is occupied by a large number of relatively small allocations.
So, what do we need to analyze a typical situation quickly? Server hardware is a good choice. The analysis process is easy to parallelize, so the more cores, the better. Regarding RAM requirements, we would rather have enough RAM to fit in the entire allocation tree. Thus, 100 GB is more than enough. If the dump file turns out to be too big to fit into memory, the excess data gets placed on disk. Therefore, having a fast drive, like an SSD or even an NVMe, is best.
The analysis tool we have developed is already being successfully used to optimize the code of the 1C:Enterprise platform.
For example, we solved the problem of reducing memory consumption by a runtime process of the infobases operating in data separation mod. It is part of a cloud-based, high-load solution used by thousands of users.
Before platform version 8.3.20, the runtime process in this solution could take up about 60 GB.
We have analyzed memory dumps using our tool. Version 8.3.20 saw a significant memory usage reduction in the platform thanks to our efforts in identifying bottlenecks and optimizing algorithms. The process now occupies approximately 45 GB of memory.
We also plan to improve this metric further, aiming to reduce the memory consumption of the runtime process to 15 GB (according to our optimistic forecasts).
Using our tool, we identified areas of inefficient memory use that were not readily apparent from the source code. By modifying and improving algorithms, we were able to reduce memory consumption by tens of percent.
Code can be written correctly and in accordance with best practices, yet there is almost always room for optimization. The key is to identify where optimization will yield significant results without introducing any problems.

Writen by


