Integration of the 1C mobile platform with statistics tools
It’s no easy task to create a user-friendly mobile application: you will rarely succeed at your first attempt. That’s why it’s important for the developer to understand whether the mobile application is intuitive, what difficulties a user faces, and whether a user applies the mobile application in a way the developer intended in their design.
To solve this multi-pronged dilemma, the mobile application may be integrated with analytics services that assist in the collection of information about application usage statistics, users’ actions, download sources, etc.
The 1C mobile platform version 8.3.17 will have a feature for integrating mobile applications with the following services for collecting statistics on users’ behavior:
-
Google Firebase
-
Appsee
-
Yandex.Metrica
At the product assembly stage, the developer selects the desired analytics service with connection parameters, after which this functionality automatically becomes available in the app.
In the mobile application, it is possible to call events (including parameterized ones) from the embedded language by sending the data to the analytics service.
A feature for managing the composition of the collected data after publication in stores has been implemented through the mechanism of the statistics settings update. This allows delegating the study of users’ behavior to people not familiar with the 1C programming language.
A user can manage the composition of the registered data by specifying both point objects and object groups for the investigation, flexibly managing event names in the services.
The new mechanism allows for the monitoring of the following data:
-
application crashes;
-
number of downloads;
-
installation sources;
-
statistics on the internal purchases;
-
user shifts on forms within the application;
-
frequency of feature usage;
-
user event registration.
Some of the services provide statistics broken down by device type and model, operating system version and areas of mobile application usage.
The Appsee service facilitates video recording from the user’s screen to further study the UI convenience and design “heat” maps. This data helps to clearly estimate the statistics of clicks in order to optimize the size and location of the interface buttons.
To ensure anonymity when recording videos, developers created some procedures for hiding (painting over) users’ private data.
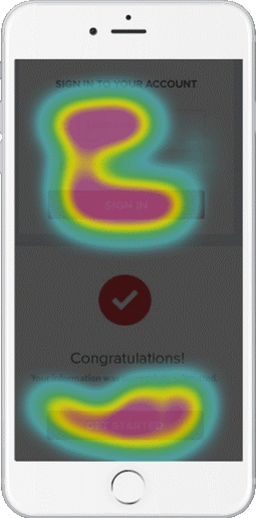
Heat map example
Let’s consider various scenarios, how collecting statistics may help improve mobile apps.
What app functions do users utilize?
There are a great number of available functions in the application’s menu. However, we don’t know the frequency with which the various app functions are used or whether certain functions are even used at all. Is the order of functions in the menu convenient?
Perhaps the user has to scroll the menu down each time in order to get to their favorite button? Or perhaps there is no sense in developing certain functions since nobody uses them?
Solution:
1) Set event sending when users start each command from the function menu.
2) Get statistics on the use of functions.
3) Sort functions in descending order by their popularity.
4) Detect unused functions.
Does the user achieve the goal?
Let’s suppose that our mobile application has a feature for data synchronization through a cloud, and we want to understand whether this feature is implemented conveniently.
By setting events for displaying the corresponding screens and button clicks we can generate statistics, informing us about how often users successfully reach their goal by setting up synchronization.

Writen by


