1C:Analytics. Using Additional Data Sources
In the previous article, we did the following: we installed 1C:Analytics and, in just a few minutes, turned data from the Sales register table into an interactive sales chart grouped by product categories. Do you remember the moment when the system figured out on its own that the Product catalog contains the Product Category attribute and that you can also group by it?
But what if our analytical task is more complex? What if we need to combine data from two different registers? Or connect revenue data in one report with sales plans for each manager, stored in a separate table? Or build a report not by turnover, but by balances as of a specific date?
This is where one of the most powerful features of 1C:Analytics comes in: additional data sources. If standard metadata objects are ready-made building blocks for reports, additional sources are our personal construction set, where we create the exact building block we need for analysis.
At this point, it’s worth noting: not every business task fits into the structure of a single accumulation register or a single catalog. This makes sense, since any reasonably complex Document in a standard 1C configuration, when posted, creates register records in a dozen or more registers. If we want to display this data in reports, we must select it from that whole set of registers.
This is where additional data sources help.
Typical scenarios where simple data sources are not enough:
- Plan vs. Actual report (Plan/Fact). Sales are stored in the Sales accumulation register, while manager plans are stored in a separate information register, or even in an Excel table loaded into the 1C:Enterprise system. How do we compare them in a single report?
- Data consolidation. We have multiple sales registers, such as SalesWholesale (wholesale) and SalesRetail (retail). Management wants a single overall picture.
- Complex calculations. We need a report not by revenue, but by margin, calculated as sales price minus cost. The data is spread across different registers.
This is why 1C:Analytics includes the additional data source mechanism. In essence, these are virtual tables that we create in the 1C query language, and the system treats them as a native metadata object, with dimensions, resources, and so on.
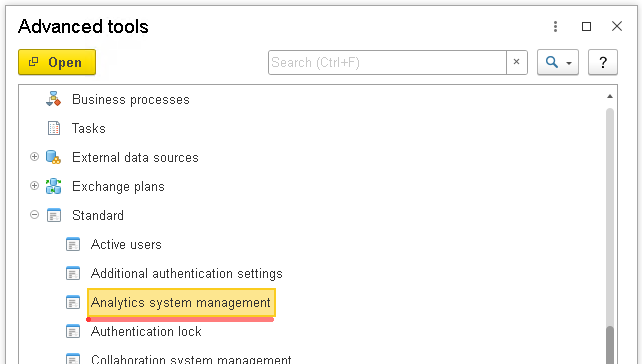
Using additional sources begins directly in the 1C application itself. It includes a dedicated data processor called Analytics system management.
Open 1C, then in the Advanced tools window, find and open Analytics system management.
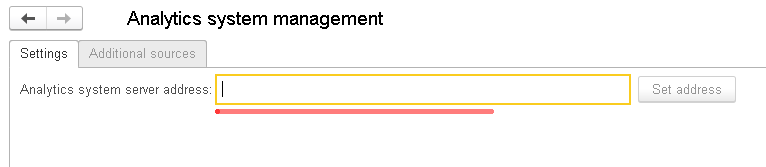
After you open the data processor, you must connect the 1C application to the 1C:Analytics server. To do this, on the Settings tab, enter the 1C:Analytics server address.
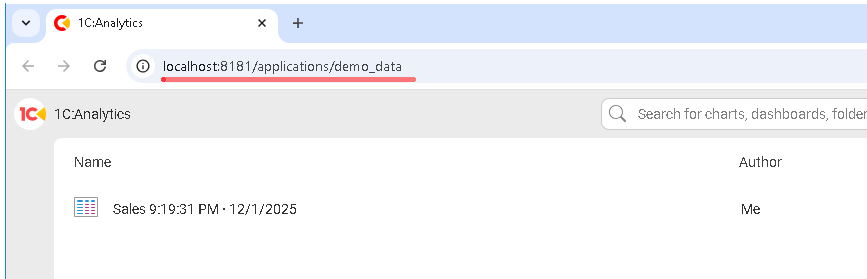
From the previous article, we know that the 1C:Analytics server address is:
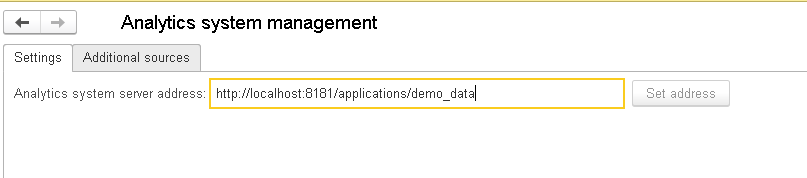
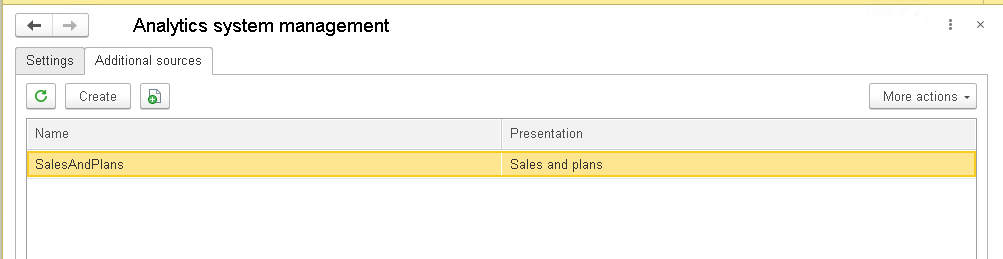
Enter this address in the Analytics system server address field and click Set address. If everything is configured correctly, 1C will connect to the Analytics server, and the second tab, Additional sources, will become available:
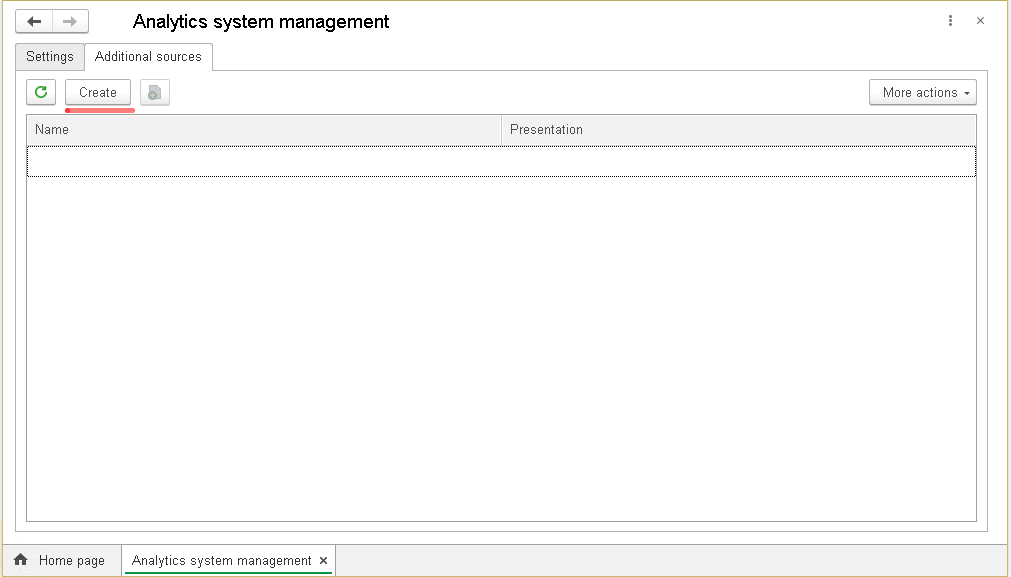
Open this tab. This is where the real power of analytics is unlocked.
Click Create.
A form opens that resembles the 1C query wizard, but in a simplified form. Let’s create a source that combines sales data and sales plans.
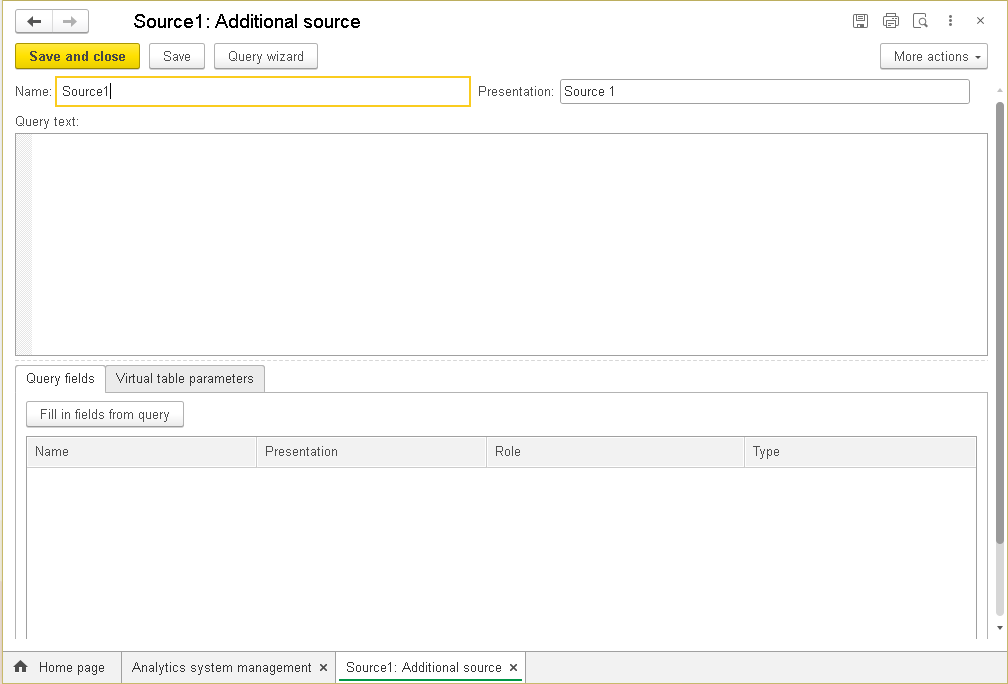
Specify the data source name and its Presentation, meaning how it will appear in 1C:Analytics. Then, simply write a query for the data using the 1C query language. Just like in Designer mode, you can type the query text manually or use the Query wizard.
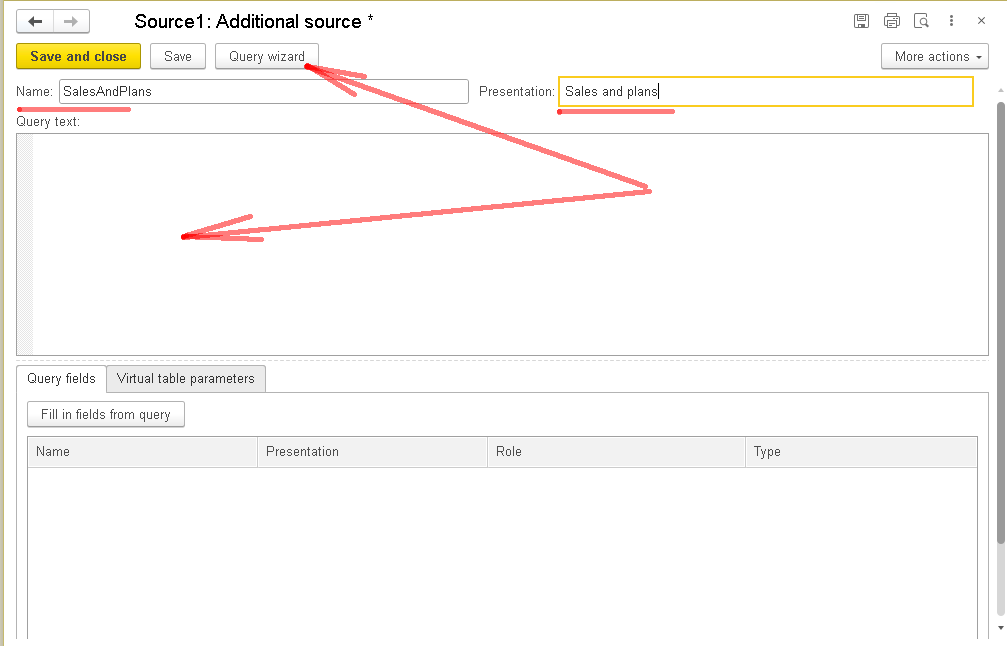
To combine sales and sales plans in a single report, we need to join data from the Sales and SalesTarget registers.
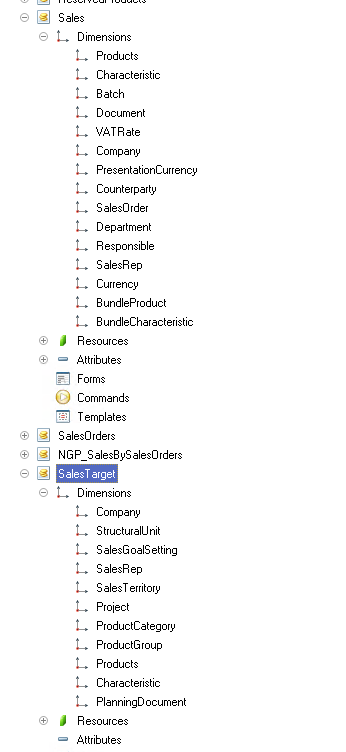
You should end up with something like this.
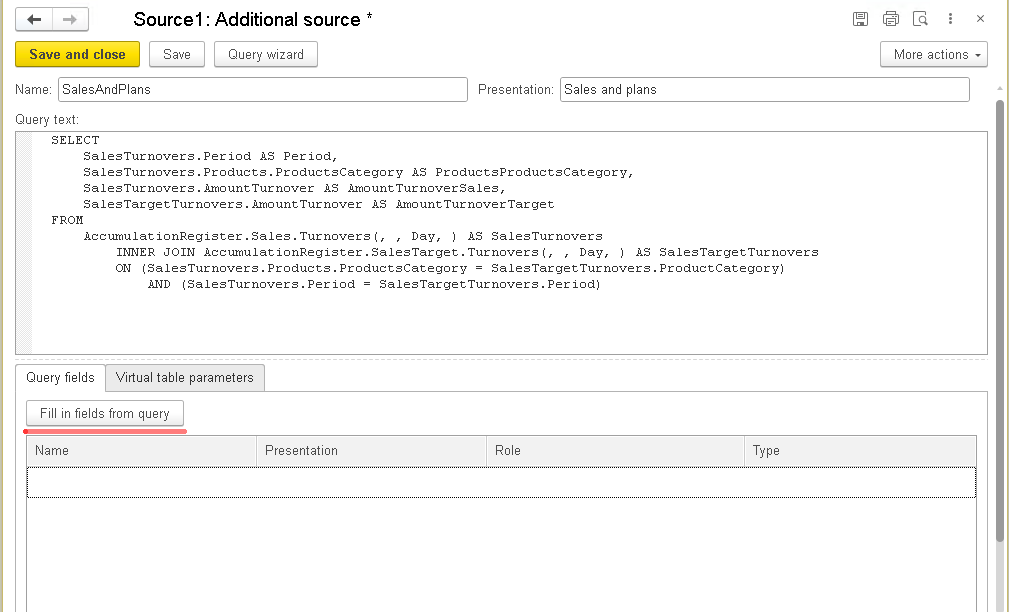
Click Fill in fields from query, and the system automatically reads the structure of your query and creates a list of fields, dimensions and resources. If needed, assign clear display names.
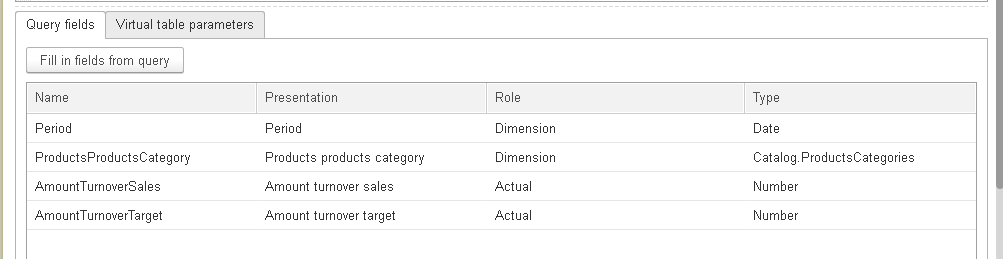
Now all that remains is to click Save and close. The form closes, and the new data source appears in the overall list.
So far, this was just preparation. Now the interesting part begins. Go to the 1C:Analytics control panel. As you may remember from the previous article, we now need to update metadata. In the menu, select Update data sources → metadata.
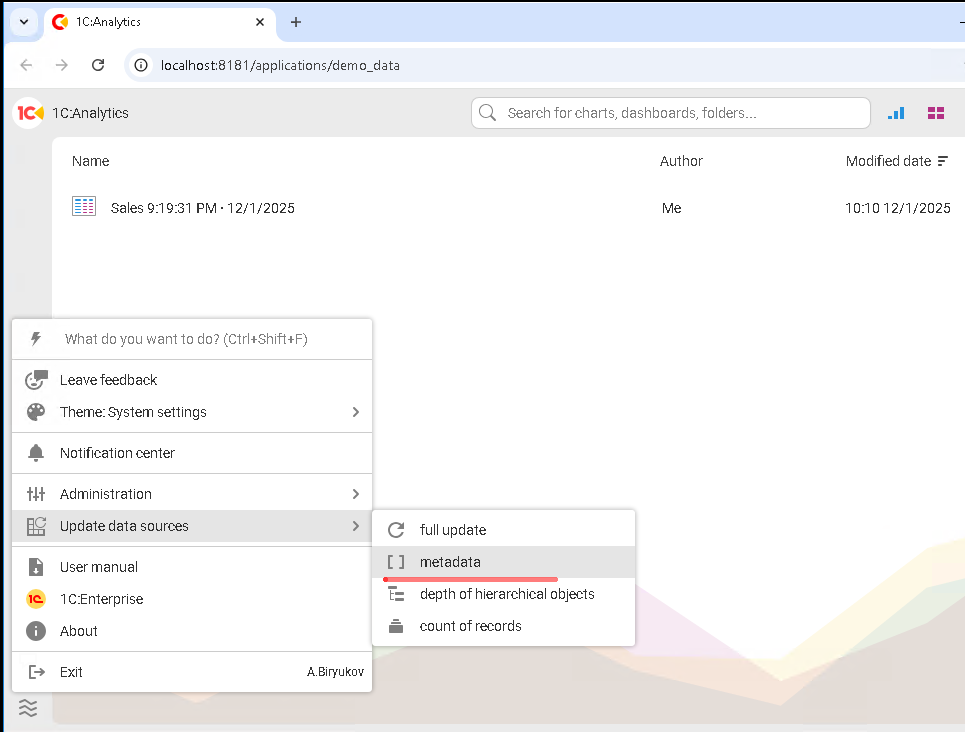
After updating metadata, create a new chart and, in the list of data sources, find the source we just created.
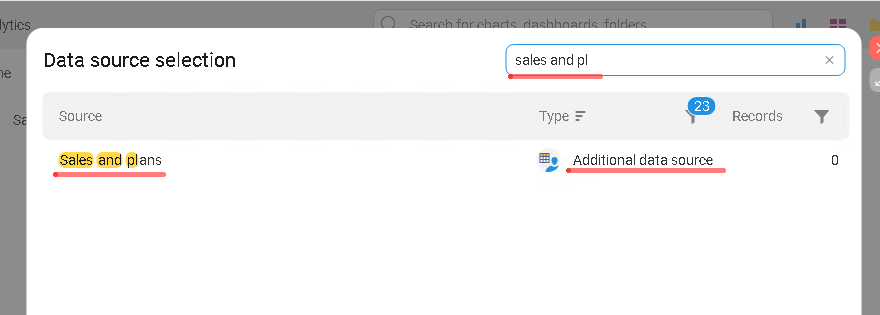
Note the source type: Additional data source.
Select this source. On the left, you will see the exact fields we defined in 1C.
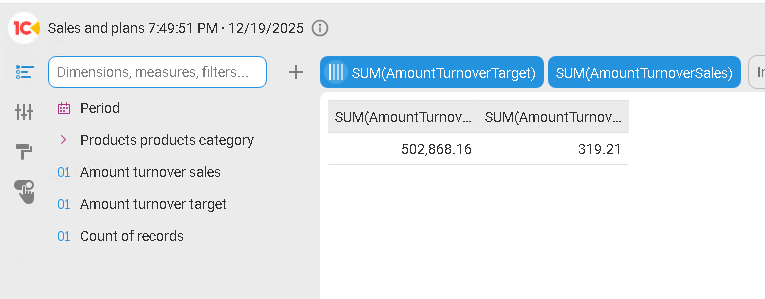
Now we can build the report we need.
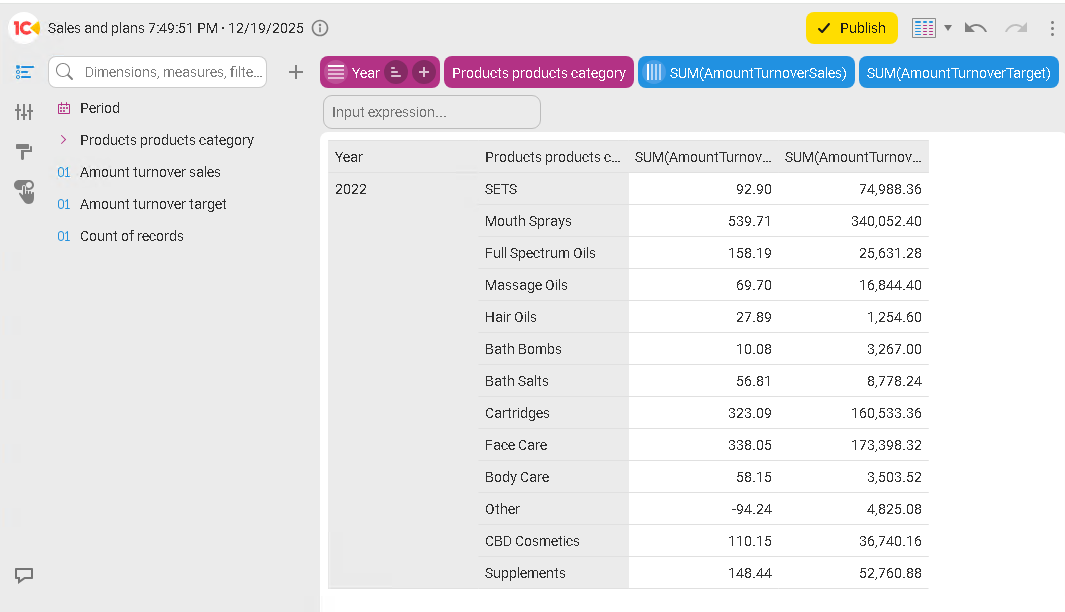
As you can see, it is straightforward. In just a couple of clicks, we combined data from different registers and built a summary report based on it.
Of course, the mechanism for creating additional sources has limitations, and we must be aware of them. The query that you create in 1C must meet the following requirements:
- You cannot use temporary tables or query packages in the query text.
- The query must support nesting, meaning it must work when embedded into another query. This limitation exists because the Analytics server embeds the query we create into its internal service query and executes it.
Now it is time to summarize what we covered today.
- We learned how to create additional data sources in 1C.
- We learned how to combine data from different 1C tables.
- We learned how to build reports in 1C:Analytics based on additional data sources.
What is next? We have learned how to handle data. But the real power of analytics is in presentation. In the next article, we will bring our charts together into a single whole, a manager dashboard. We will see how to link several reports, configure cross filters, and present information so that the right management decision is obvious at first glance.

Writen by
1C Developer
20+ years of experience in the software industry in Russia, UAE and Germany. My main fields of expertise are developing and implementation of business applications (Retail, CRM, WMS, and Accounting) and integration of software with POS equipment and web portals.


