Designing Business Applications with the 1C Platform Algorithms. Part 4.

Designing Business Applications with the 1C Platform Algorithms. A Detailed Description of the Platform Mechanisms Operation.
Part 4. A Report to Control Current Warehouse Stock.
In the third part of our series of articles, we created the second document for the system we are developing. It is a sales invoice document. With this type of document, users register a business activity reflecting sales of products from the company warehouses.
Unlike the previously created supplier invoice document, a sales invoice not only adds records to register ProductsInWarehouses but checks stock balance during posting. If the stock is insufficient, it terminates the process and returns an error. Thus, if we have 10 units of some product in our warehouse and want to sell 15 of them, the application prevents us from doing it. In order words, we have a stock control function implemented into the sales invoice document.
Nevertheless, company employees need to know about their warehouse stock not only when they create sales invoices. Basically, controlling warehouse stock is among the essential responsibilities of employees dealing with warehouses and procurements. No company can properly operate without this functionality.
So what is a quick way to find out the current warehouse stock? With the 1C platform, there is a dedicated object allowing to build reports of any complexity. No wonder that the name for this object is report.
As the 1C platform has been around for quite some time, there are several ways to create and use object report. Some of them are pretty complicated; others are easy to implement. For this suggest I suggest we consider the simplest and fastest way of creating reports within the platform.
But before we proceed, let say again what kind of report we want.
We want a report that contains data on current stock. As we have several warehouses, we need to know the stock per warehouse. Additionally, as we have products from different manufacturers, we want to have them listed in the report as well. Naturally, users should have an option to build the report for a specific date and warehouse.
Let’s do it. Go to Designer and find section Reports in the tree. Create a new report.
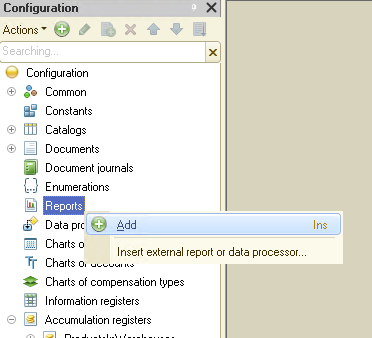
I suggest we call it StockStatement:
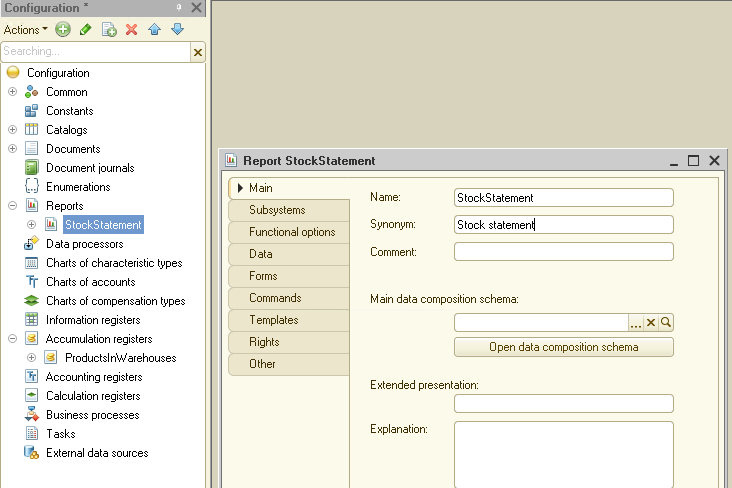
As mentioned above, the 1C platform offers several ways to create reports. Data Composition System(or DCS) is one of them. Currently, this approach is the most efficient for creating reports in applications built in the 1C platform. For this reason, we want to use it for our task here.
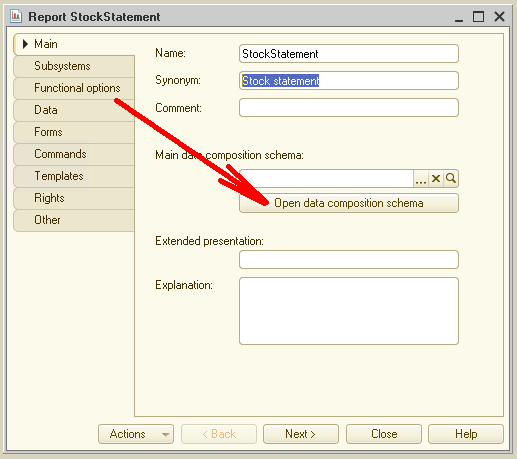
Click button Open data composition schema:
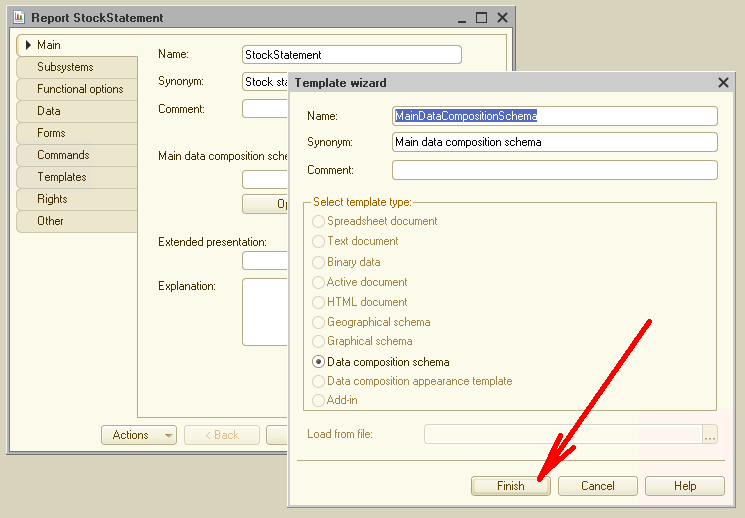
You get a dialog with option Data composition schema selected. Nothing to change here. Simply click Finish.
You immediately get a form that you can use to design the report required. So let’s proceed with setting up the required parameters:
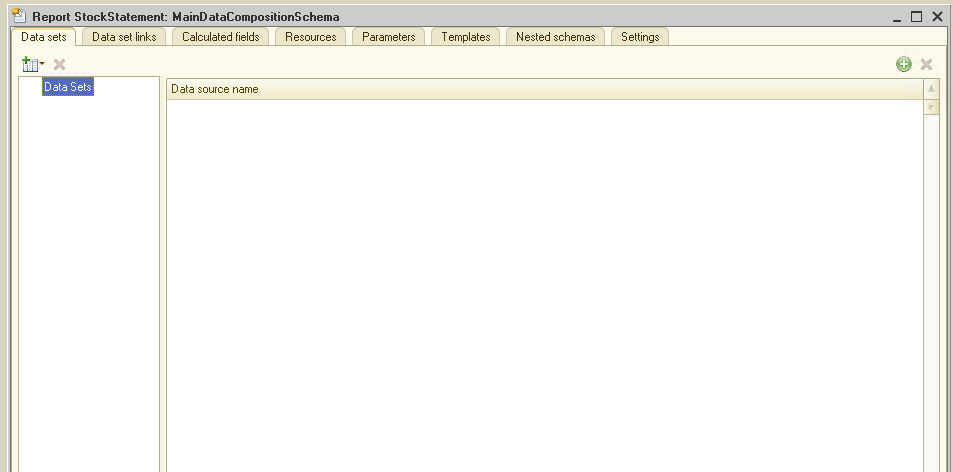
We start by specifying DataSet that our report should use as the source. Click button Add to access context menu:

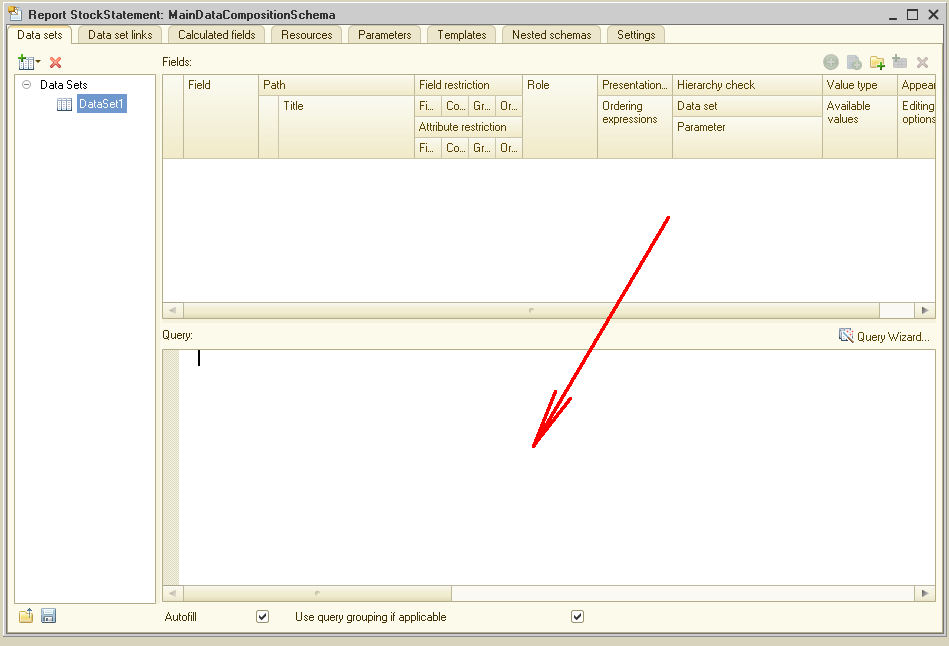
As you can see from this menu, a DataSet can be a DB query, an object in our application, or a union. In almost all cases, a DataSet for reports relies on DB queries. It is the most efficient way, and it is easy to set everything up. Pick DB queries as the source of the DataSet in the context menu. Now you see the form change. We get a window in the right lower level corner:
You can either create a query yourself or make use of the wizard. It seems unreasonable to manually create complex queries when there is a wizard option. Click button Query Wizard.
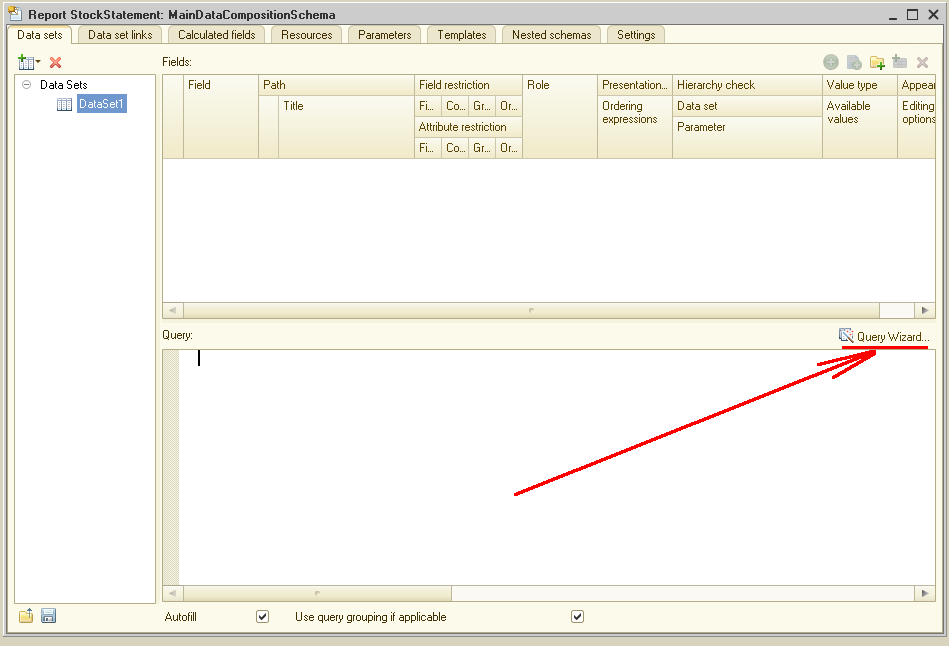
You get the Query Wizard Form that looks like this:
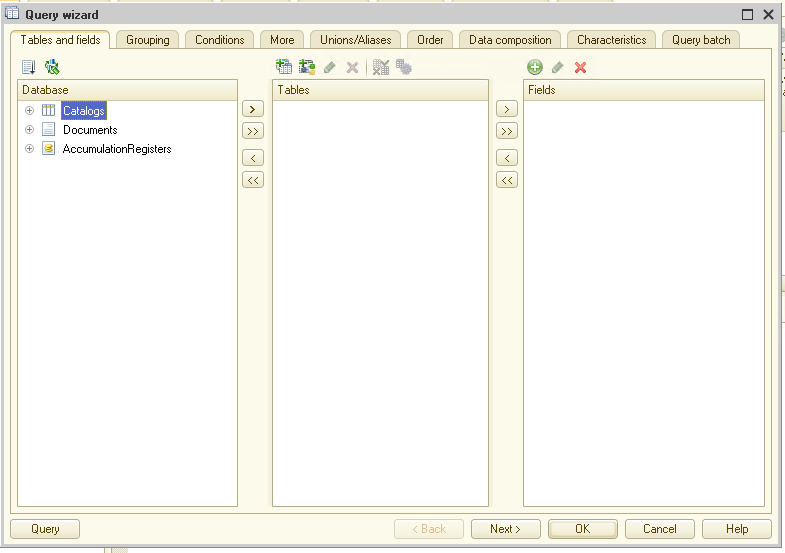
Now we select a table as a source of data for the report. As you remember, we are interested in warehouse stock. Go to list AccumulationRegisters and check tables we have available:
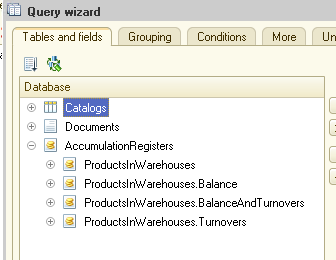
As there is only one accumulation register, we do not see many data tables. This is the accumulation register ProductsInWarehouses itself and three virtual tables to the register that the 1C platform creates automatically: balance, turnovers, and balance & turnovers.
Naturally, we are interested in the table for balance. Move it to section Tables:
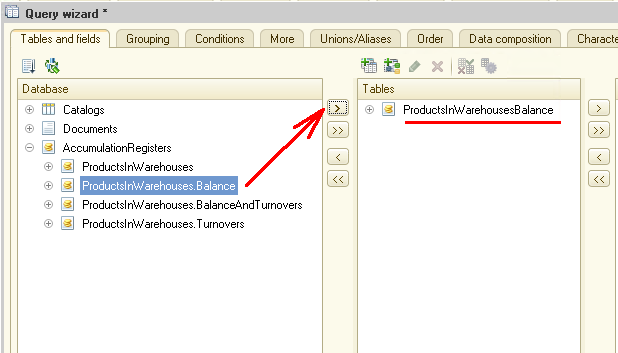
If you have experience with queries in the 1C platform, you know that every virtual table has specific parameters that we set in advance. The same applies to virtual table ProductsInWarehousesBalance.
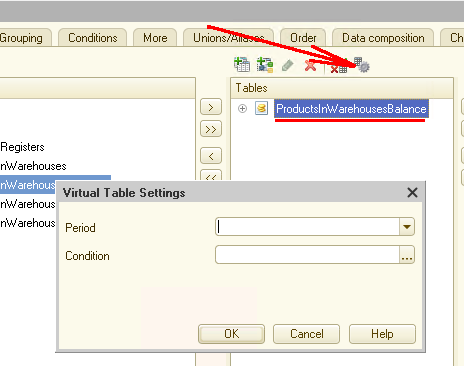
Still, we are not specifying virtual table parameters in our case though the report uses some of them. We skip this step because data processing takes place on the level of the Data Composition System. Leave the fields blank and proceed.
Here we should specify the fields in the virtual table to be included in the report. Expand the list of available fields:
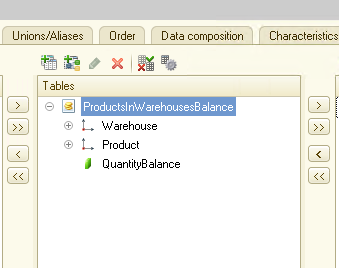
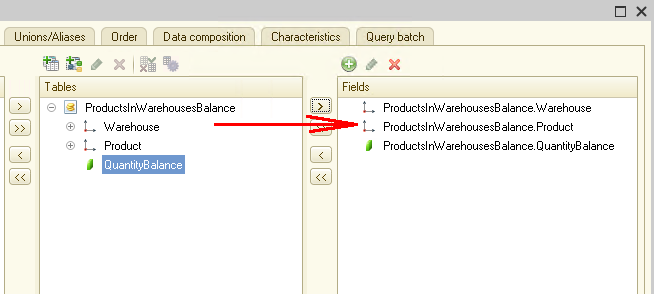
The register, in our case, is pretty simple with not so many attributes, so the virtual table is equally simple limited to just three fields: Warehouse, Product, and QuantityBalance. We need all of them for our report. So, move these elements into section Fields to the right:
Also, we want information on product manufacturers in the report (keep in mind that in our case, the Manufacturer is an attribute in catalog Products). We can retrieve this information with a query as well:
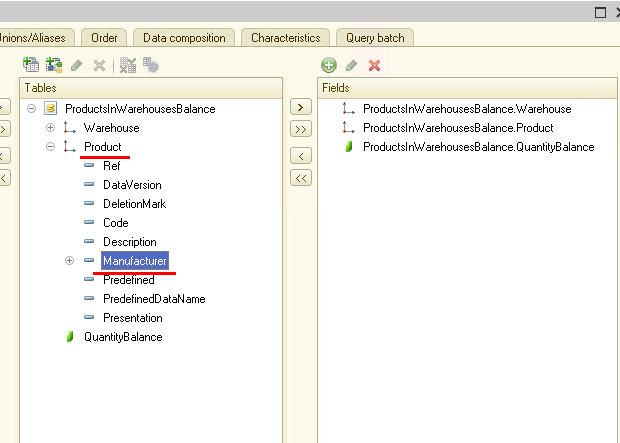
But this is not the most efficient way. We are going to get the information on manufacturers through the Data Composition System, which is a higher level.
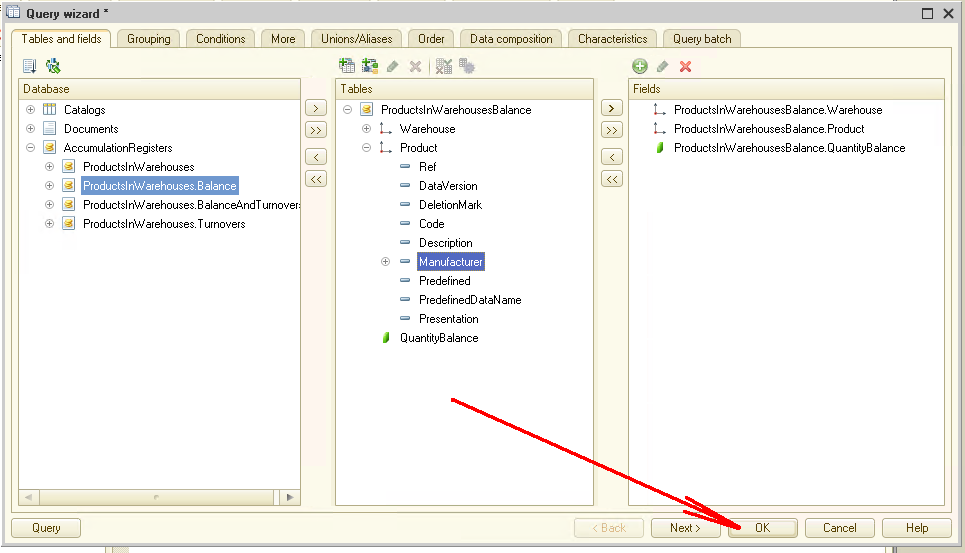
Well, we have defined the table containing data for our report and specified the fields we want to include in the query. We are ready to create the query. Simply click OK:
The query wizard closes, and we get the text of the query:
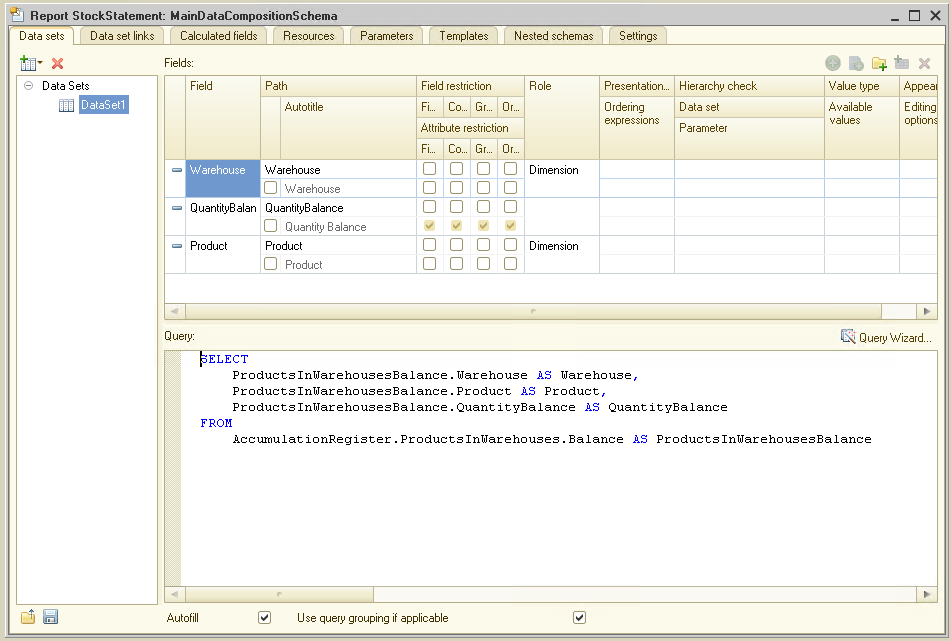
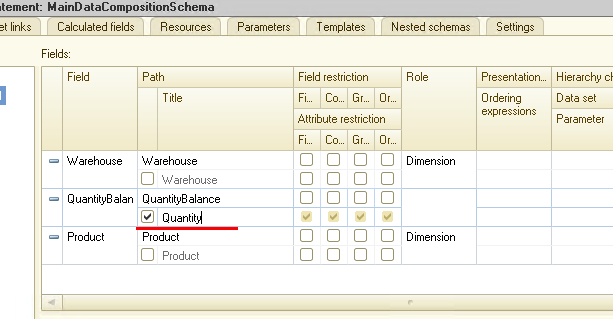
In the upper right window, you can see the list of available fields.
There are so many unique settings for these fields that it is impossible to describe them within this article. Thus, the only thing we do here is changing the name for QuantityBalance as follows:
Then we skip tabs Data set links and Calculated fields (we do not need them in our case) and proceed to tab Resources.
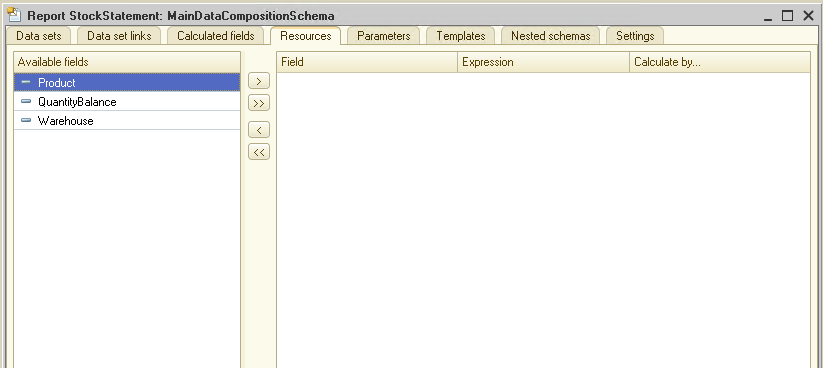
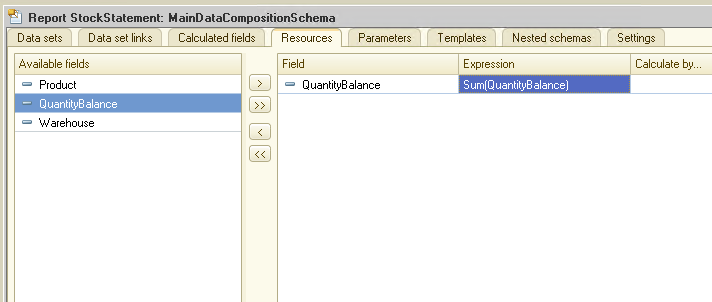
Over here, we select the fields the application should use to calculate the results published in our report. We pick just QuantityBalance. Tell the system we want to get a sum for this field:
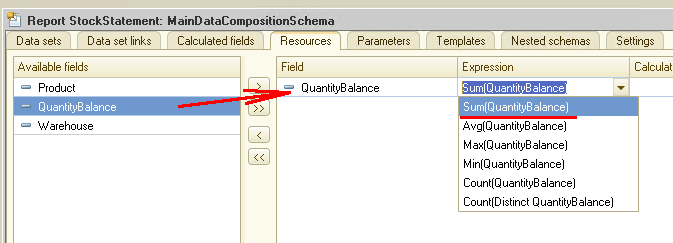
Pay attention that developers have a selection of aggregate functions that include not only SUM value, but MEAN, MINIMUM, and MAXIMUM ones, as well as QUANTITY. Let’s pick aggregate function SUM:
Switch to tab Parameters:
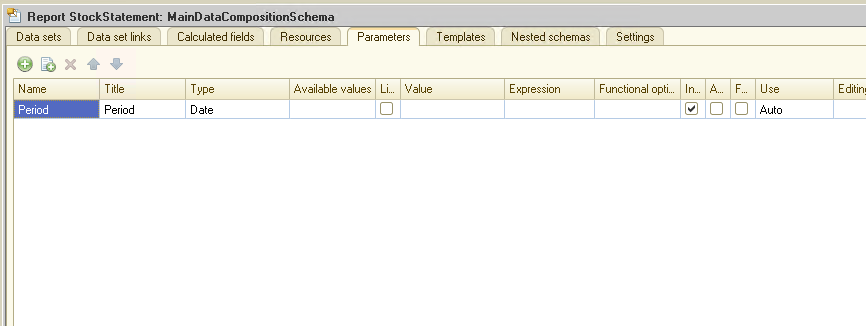
As you can see, we have a single automatically created parameter Period. Naturally, you might wonder where it could come from. You sure remember that we added no parameters when creating queries for this table. Still, there is one parameter, Period, that is predefined, and this is why we get it in the tab Parameters.
Let’s take a look at our virtual table and its parameters:
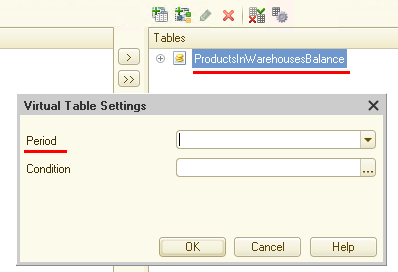
Should we have included any other parameter into the query, say Warehouse, this parameter would be available on tab Parameters, just as Period is.
We skip tabs Templates and Nested schemas as we do not need them for our task.
Get to tab Settings. It is here that we define the key settings for our report.
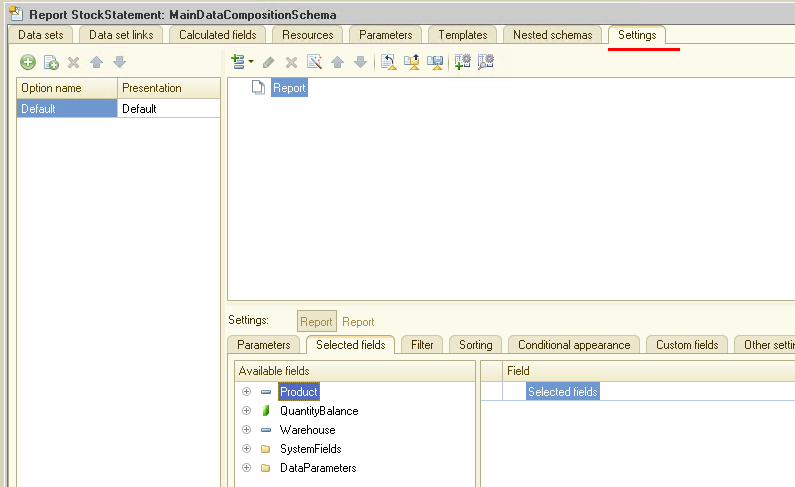
You can manually create the report structure, but using the wizard is much more convenient. Start it with button Settings Wizard:
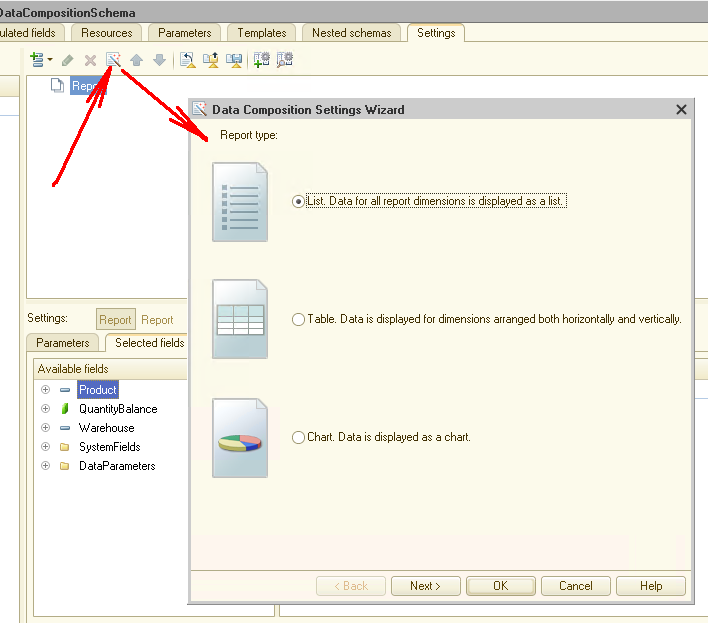
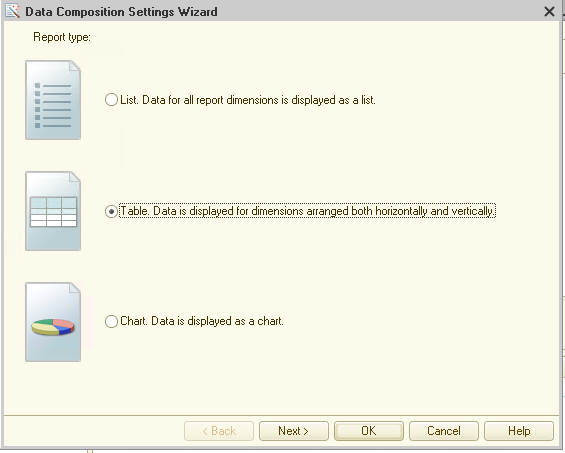
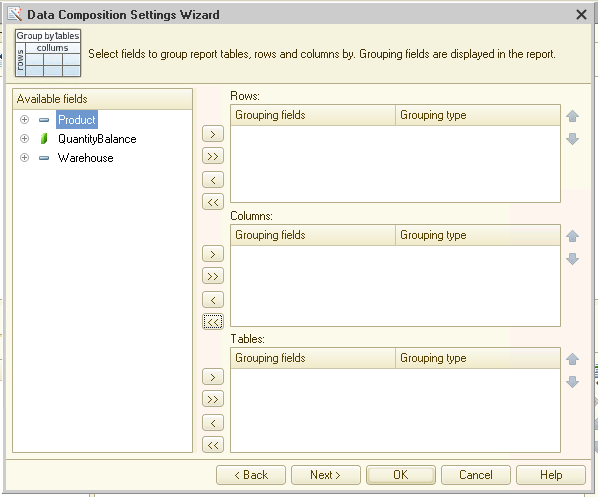
Pick the report type. We opt for a table as we want to place products and manufacturers in rows, while warehouses and stock per warehouse go to columns. Pick option #2 and click Next:
You get the following form:
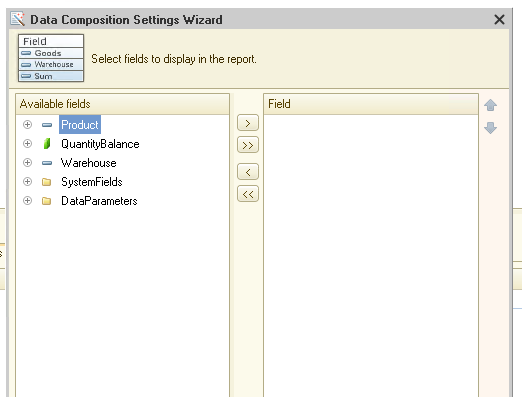
Here we set fields to be included in the report printed form. These are three fields: Product, QuantityBalance, and Warehouse:
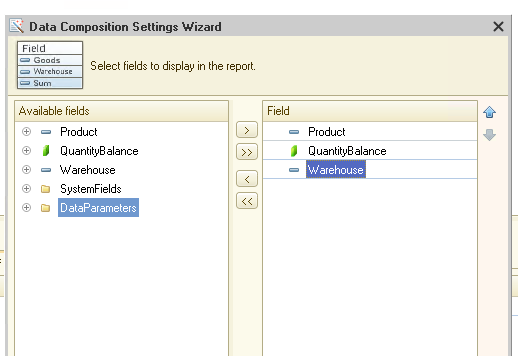
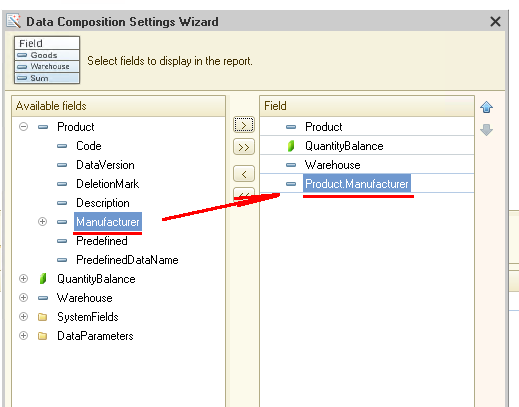
Bit wait! What about the manufacturers we need in the report? How do we make this field visible? It is easy as that:
Then click Next
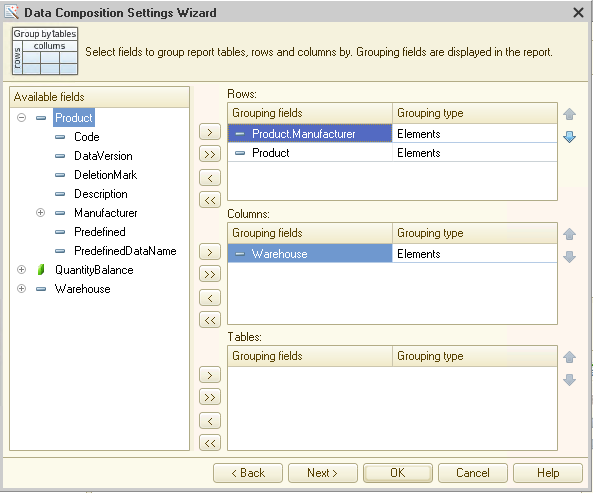
to proceed to the table settings:
Here we allocate fields to rows or columns as we think fit. We send Manufacturer
and Product to rows. Make sure you do it exactly in this order if you want products sorted by the manufacturer. Put Warehouse to columns:
Click Next
and proceed to the next tab:
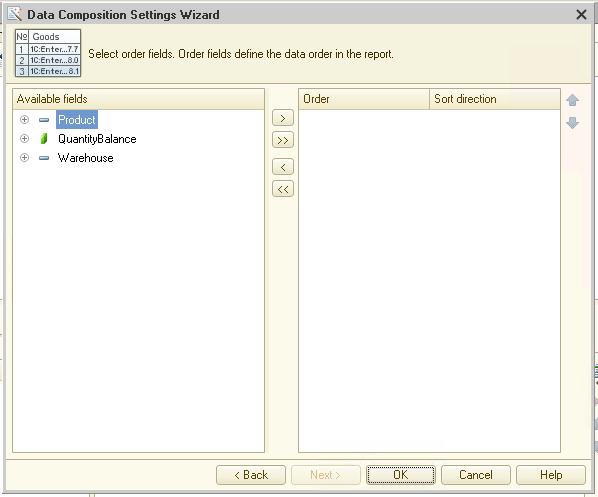
This tab defines parameters for sorting. We do not need it this time.
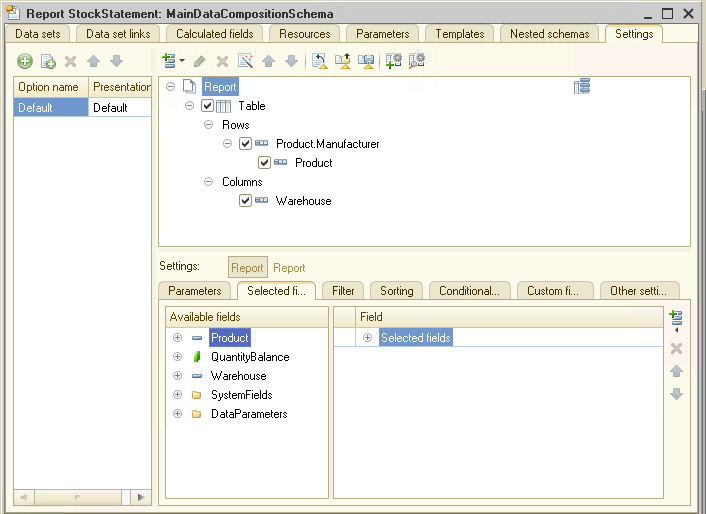
Click OK. Now we get the so-called report settings structure that the wizard has created for us:
Technically, our report is almost ready. It is time to switch to the dialog mode, test the report and make some adjustments right within the dialog mode.
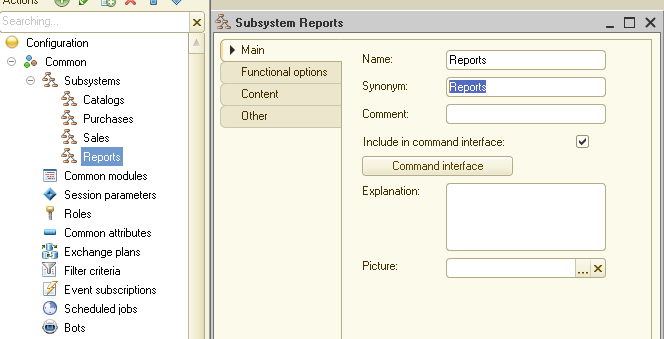
But before that, let’s create one more subsystem and place the report into it.
No wonder that the name for the subsystem is Reports:
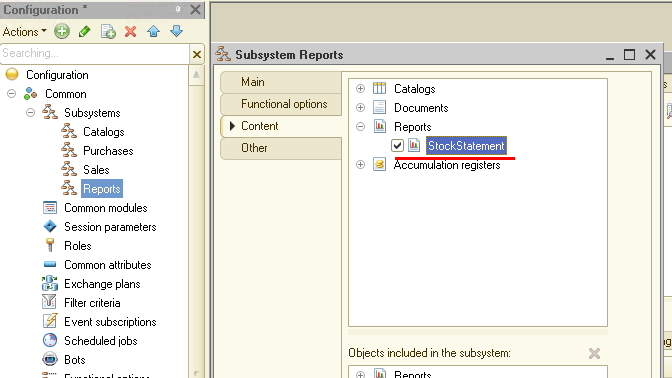
Place the report into our subsystem:
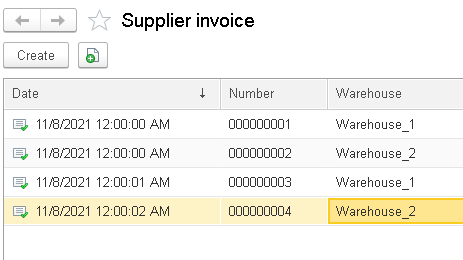
Now start 1C in dialog mode and add several supplier invoices. At that, we want to use different warehouses in them. Thus, set Warehouse 1 in two invoices and Warehouse 2 in the other two:
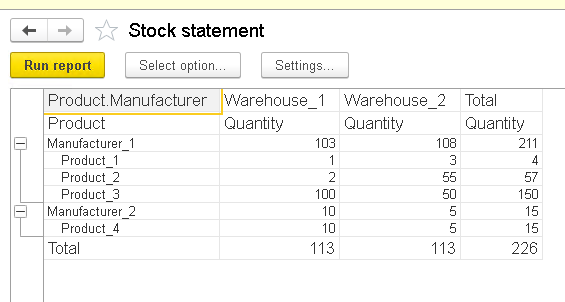
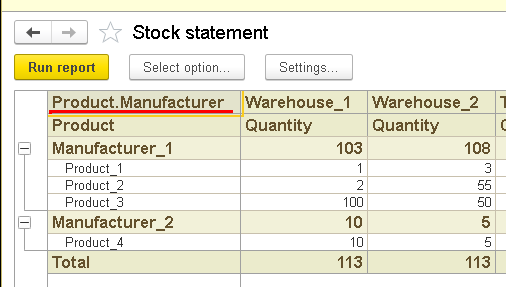
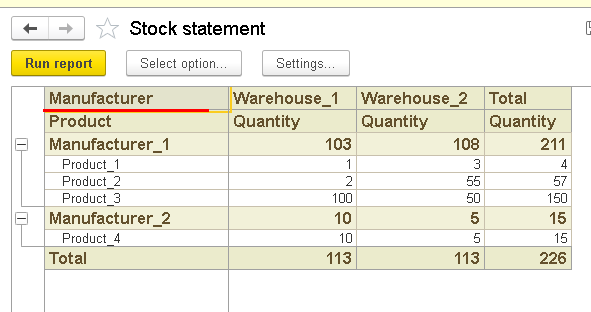
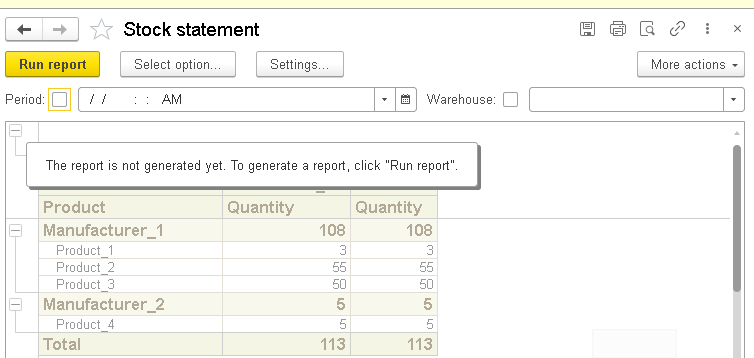
Let see what we can get now. Open subsystem Reports, go to the report screen and click button Run report. Here is what we get:
Congratulations! We have hit the finish line. But before we call it a day, I suggest we add some beauty.
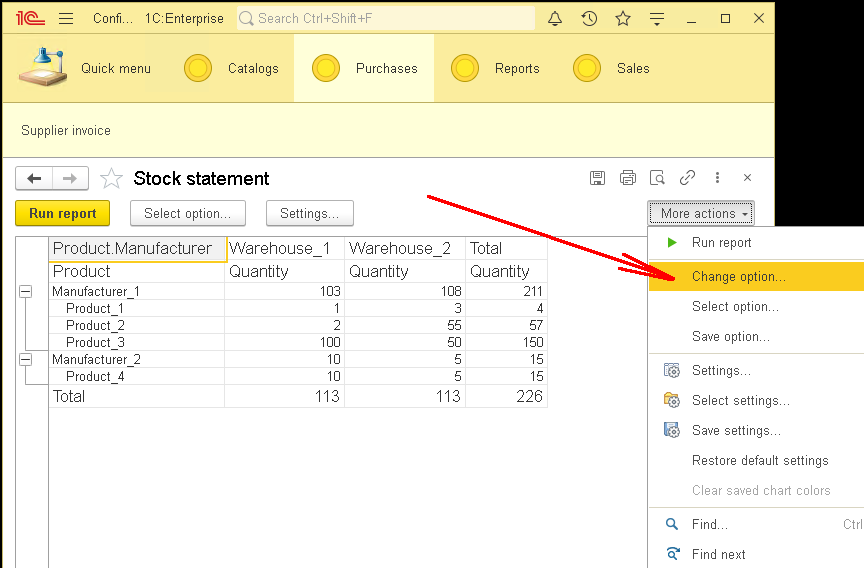
Layout settings are available both through Designer and dialog mode. Let me show you how to do it in dialog mode.
Click button More actions to get to the drop-down menu. Select Change option...
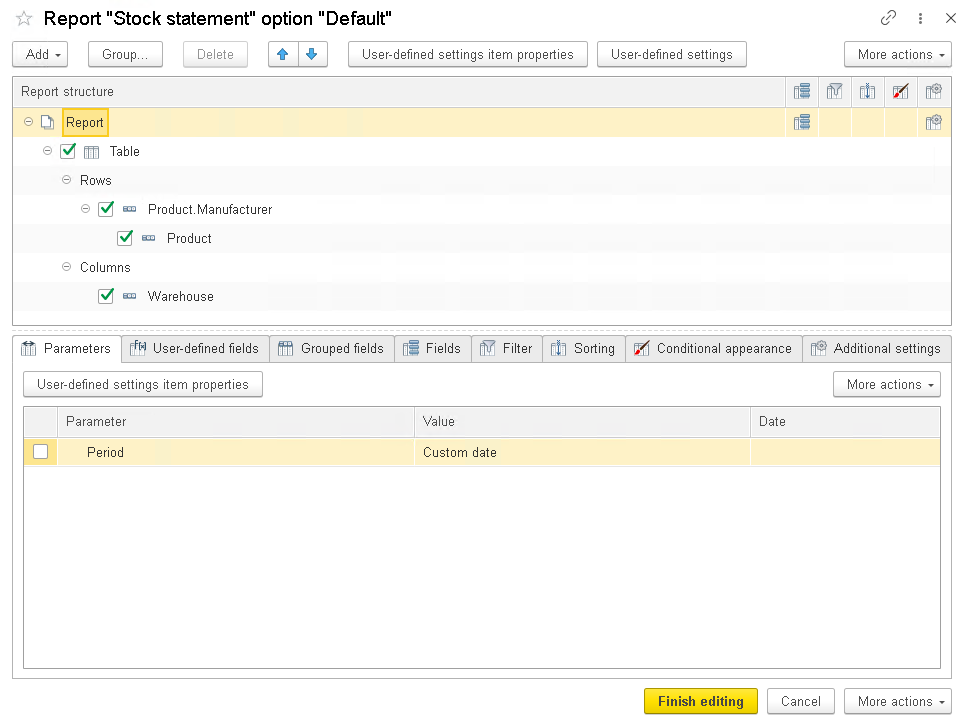
You get to the report settings almost identical to the one we have in Designer.
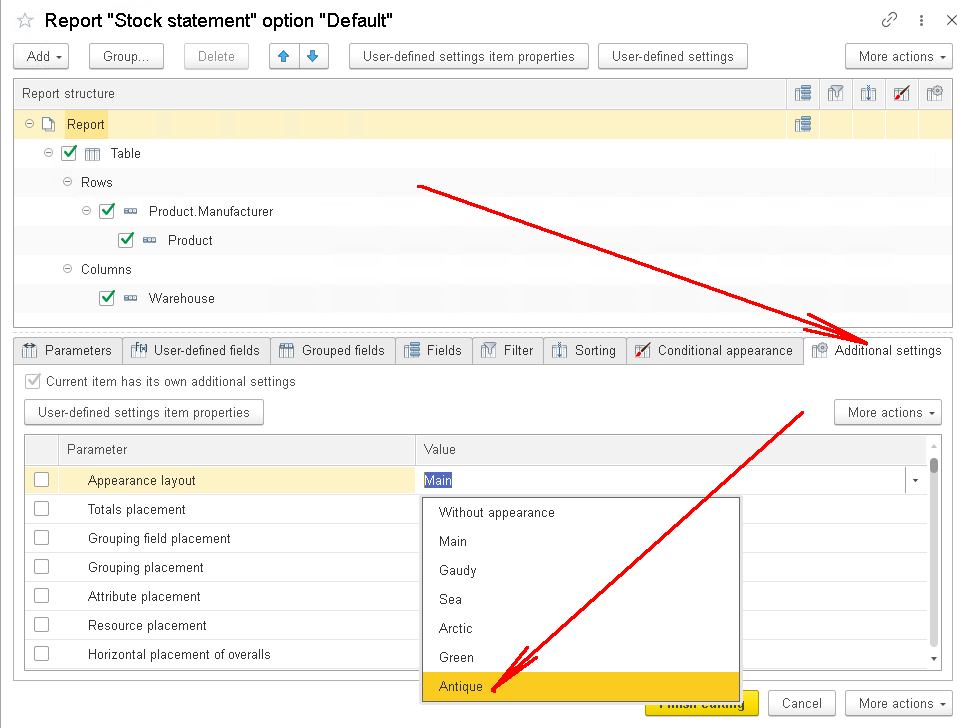
Switch to tab Additional settings and select one of the predefined appearance layouts. My personal favorite is antique:
Click Finish editing to close the report settings. Create the report once again with Run report.
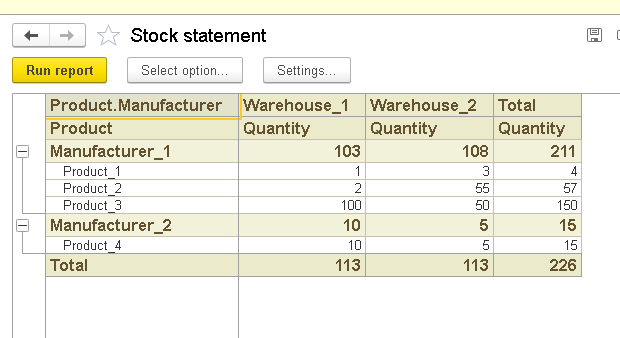
You see the difference, don’t you?
Still, it seems that field Product.Manufacturer does not quite fit in:
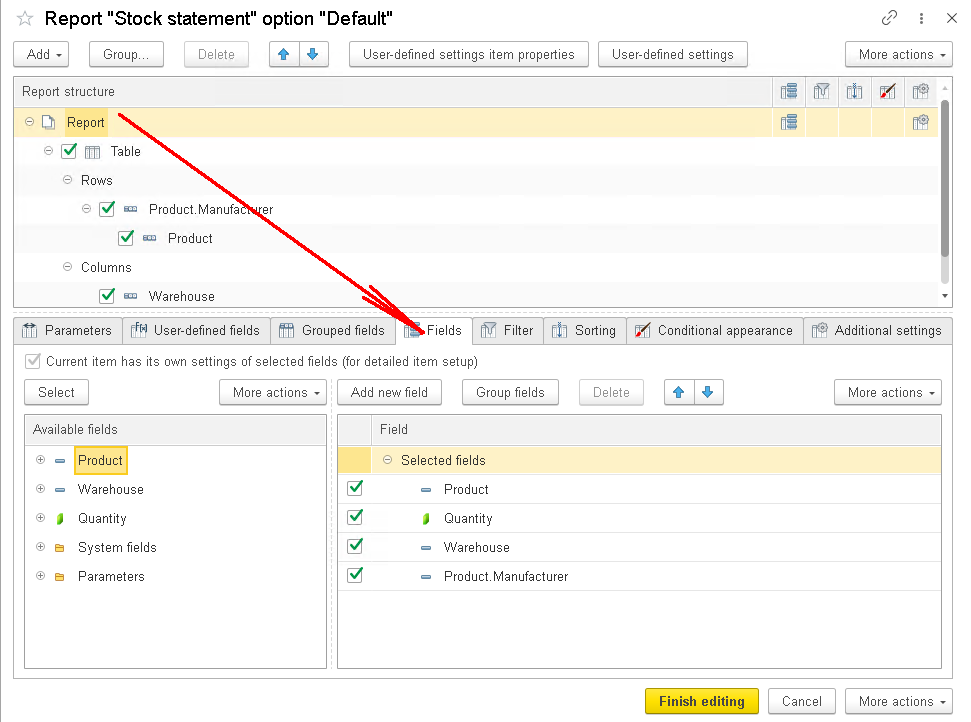
How about changing it to Manufacturer? Return to report settings as described above and proceed to tab Fields.
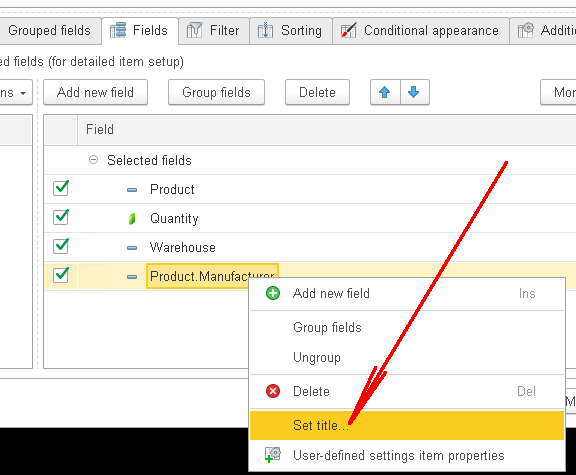
Right click the field Product.Manufacturer to access the context menu. Select option Set title...:
Modify the field name as we agreed:
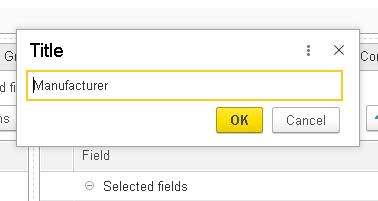
Click OK, then Finish editing and generate the report once again:
We see that our new settings work as needed.
Excellent! What else do we have to do? We have almost forgotten that users might want to know stock for a specific date. Right now, we can generate the report for the current date only. Also, users might want to know stock for a particular warehouse and not all of them.
Thus, to have the report fully functional, we add parameters Period and Warehouse to the report form. Here is what we do with the first parameter.
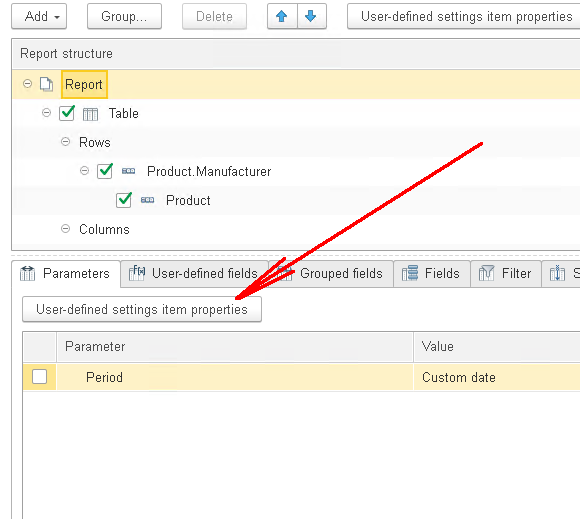
As it is predefined, it is easy to add it. Go back to the report settings again, and find button User-defined settings item properties in tab Parameters.
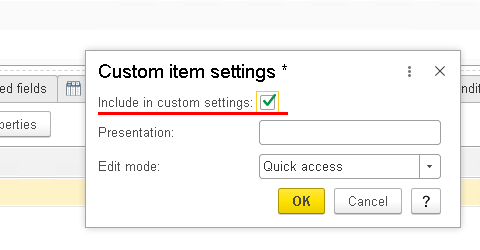
Click the button and flag option Include in custom settings:
Now we go back to the report to see that we have parameter Period available.
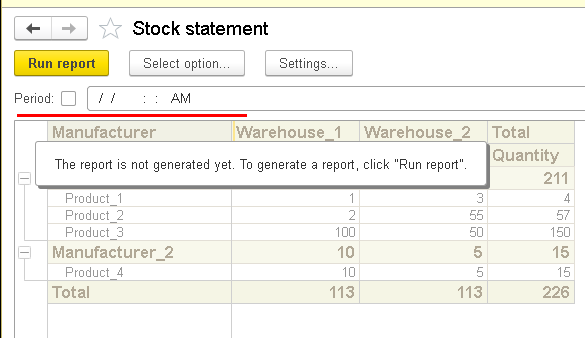
Users have received an option to generate the warehouse stock report for a particular date.
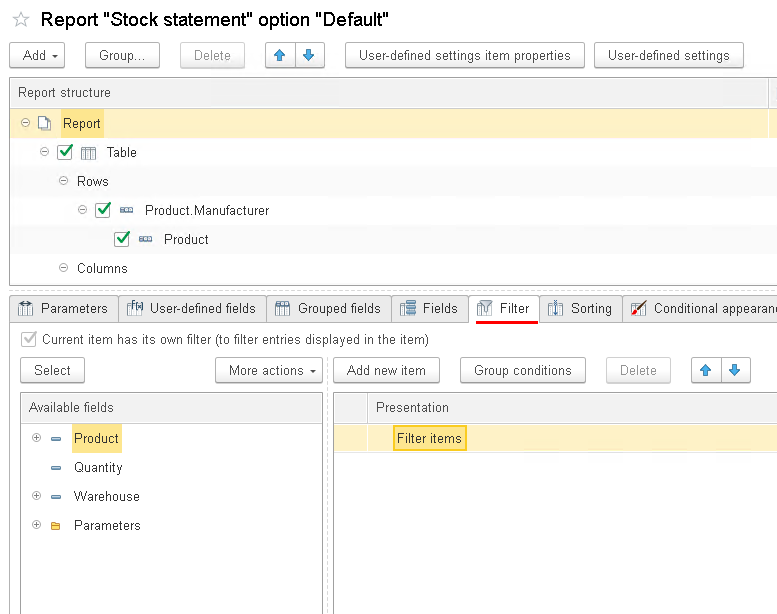
Great! Let’s make it possible to filter data by warehouses. We do it the same manner: open the report settings and switch to tab Filter:
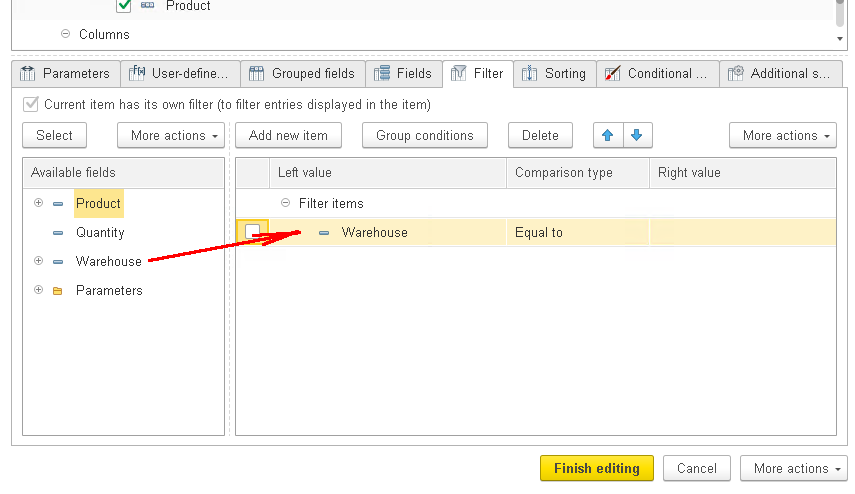
Drag the field Warehouse to the right section:
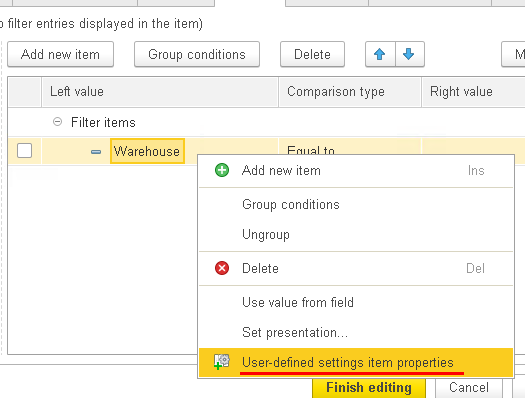
Right click this field and select User-defined settings item properties in the context menu.
Flag option Include in custom settings:
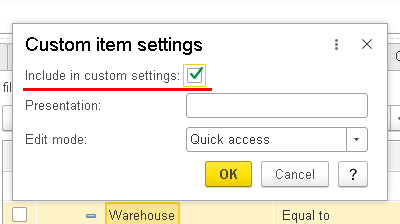
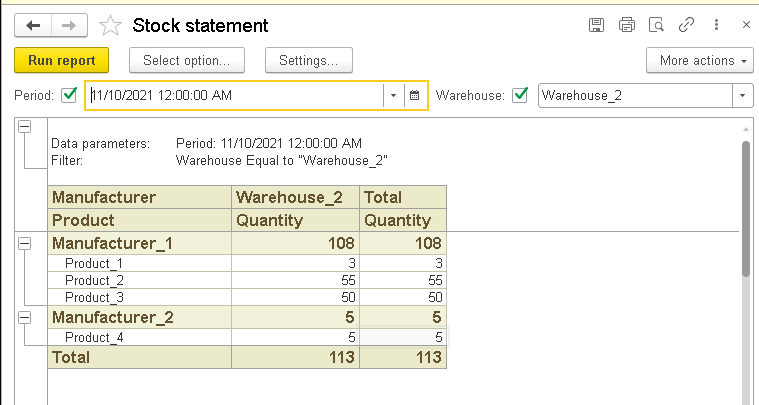
As we go back to the report, we see that parameter Warehouse has become available.
So users can now get info for a specific date and warehouse.
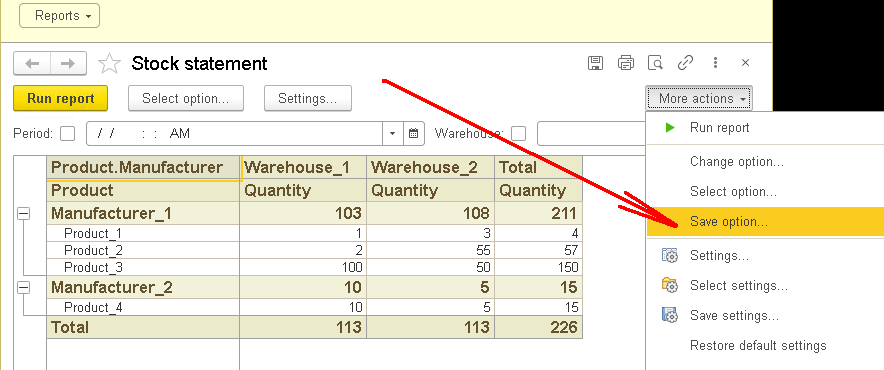
And the last thing. To use updated settings later, we should save them:
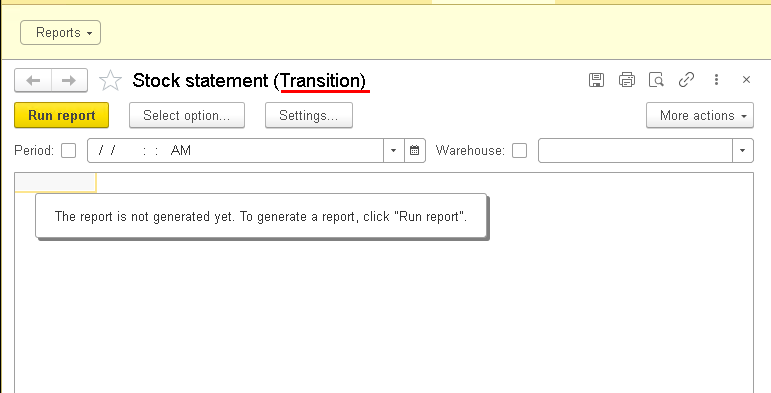
Pick any name you like:

Saved settings remain active next time users select the report:
It seems we are done here. We have created a convenient tool for users to control the company warehouse stock. The report can provide information on all warehouses or just one of them. At that, users can get data for any specified date.
What is coming next? Seems obvious to me. For now, we have been dealing with quantities, that is, the number of products purchased, sold, or available at warehouses. But we all know that the primary purpose of any business is to gain profit and thus dealing with quantities is totally not enough. We need to evaluate our purchases and sales in money. In the end, it is the path that leads to understanding if we make a profit and how good we are.
This is what we are going to cover in future articles.
As usual, I am glad to share the link to the example we have used in this article.
Stay tuned!

Writen by
1C Developer
20+ years of experience in the software industry in Russia, UAE and Germany. My main fields of expertise are developing and implementation of business applications (Retail, CRM, WMS, and Accounting) and integration of software with POS equipment and web portals.


