Business requirements make it necessary to quickly receive operational information from corporate information systems. For this, a tool is needed for fast development and modification of reports for all details and measurements to quickly change the presentation of the data necessary for the visualization of large information volumes. A 1C platform is a tool for rapid business application development that provides a powerful mechanism: a Data composition system, which facilitates the generation of reports of any complexity. In this case, the 1C platform uses a low-code approach, where the development is largely driven by visual modeling and the use of embedded mechanisms and code programming is used only in some specific or unique situations.
Moreover, an important feature of the Data composition system is that the user can independently customize the report appearance, use various filters and grouping methods, and all these actions are performed in the user mode of the 1C platform, which requires zero assistance from a professional programmer. According to the modern classification, users who are able to modify the software functionality with no coding are called Citizen Developers.
Let’s study some simple examples of report creation using the Data composition system.
Earlier, we developed the MobileScannerServer configuration, and now let’s create two reports for this configuration:
1. Goods list output
2. The output of the list of available Inventory documents. The report should also display the goods, their quantity and SKU.
We won’t embed the reports into the configuration; they will be created as external files. To open such an external report, it’s not necessary to have programming skills. A user can modify it without affecting the central system, which significantly facilitates and accelerates its implementation. Below, we will see how this is done.
Let’s create a report that will display a list of goods in the Products catalog.
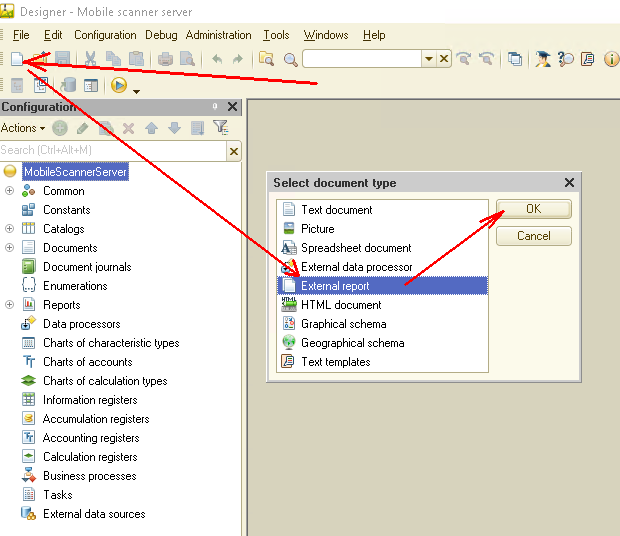
In the Designer main menu, click the New document button (Ctrl+N), then the Select document type dialog will be opened. Select External report and click OK:
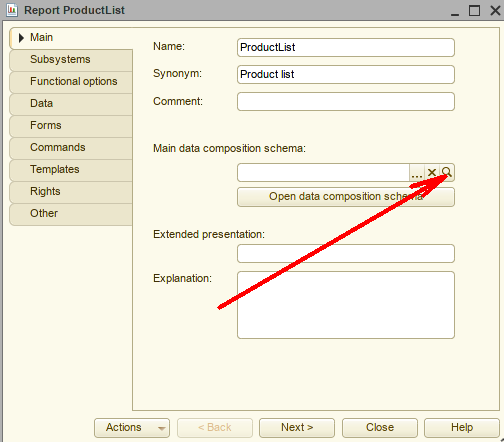
A new report form will be opened. Name it ProductList and click the button for creating Data composition schema:
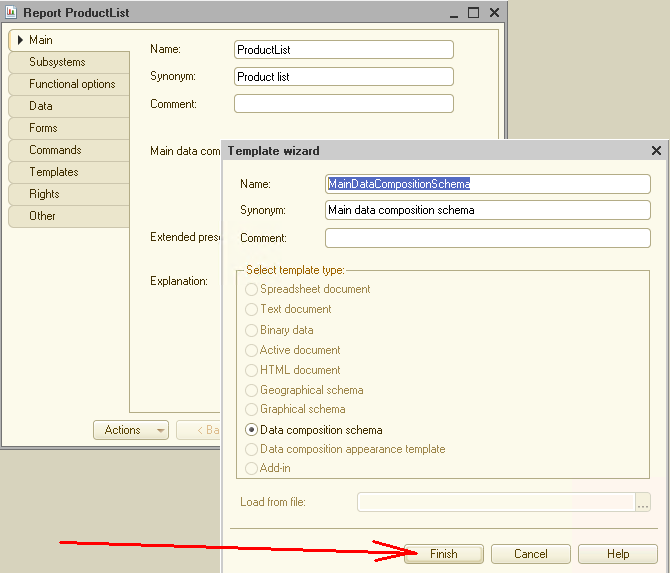
Then, click Finish without changing the name:
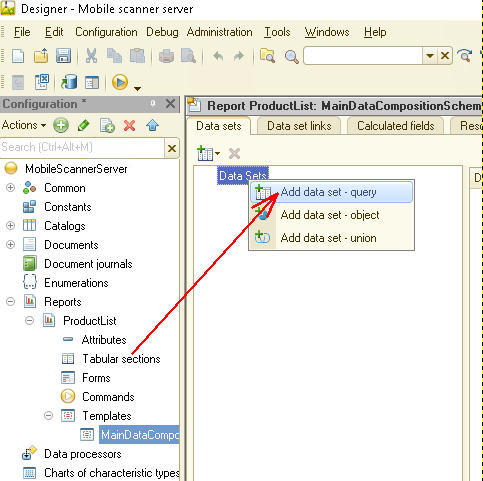
Now, we need to add a DataSet to the Data composition schema. Select Add data set – query:
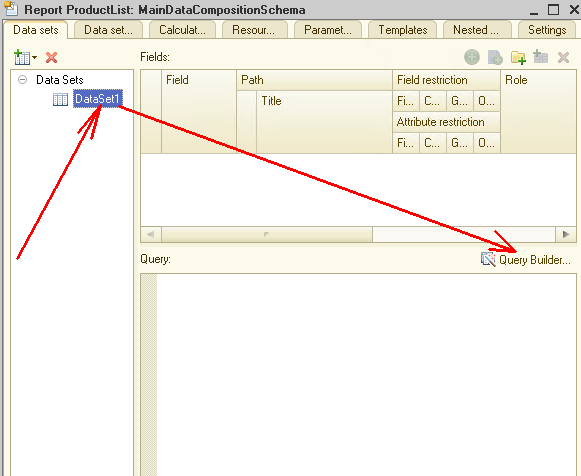
We do not change the DataSet1 name and click the QueryBuilder button:
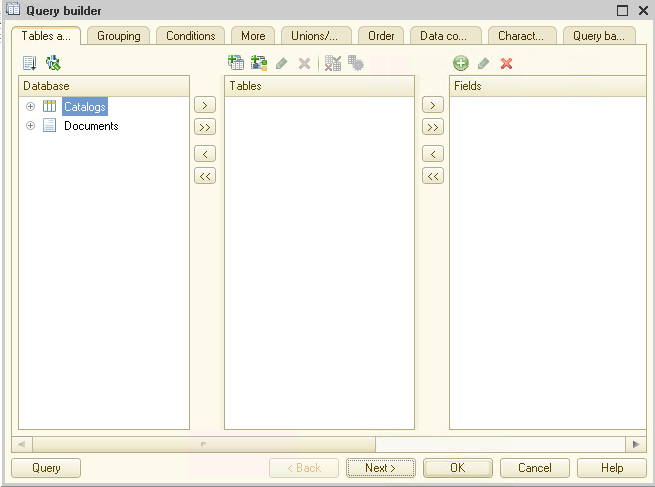
Now we have arrived at the Query Builder window. Here we choose “SELECT”, which will return us to the list of all our products from the Products catalog. The Query Builder window has three columns: Database, Tables and Fields. The first column displays all the configuration objects, the second one – database tables from which we will select data for the report, the third column contains the filed which we want to see in the report.
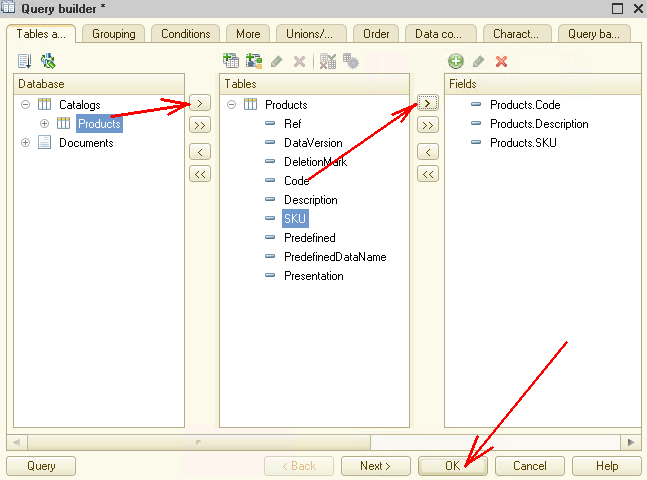
So, we drag and drop our Products catalog to the Tables column. Next, move the Code, Description and SKU fields to the Fields column. These fields will be ultimately displayed in our report. Click OK:
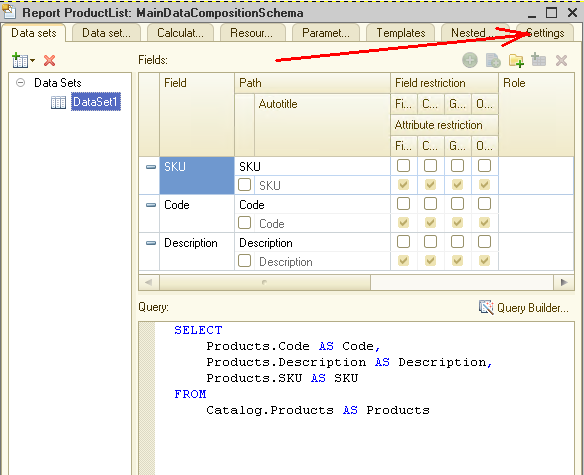
After that, the Query Builder window will be closed, and we see the Data composition schema again. Please, note, that there is just created query text in the Query window.
Now, go to the Settings tab:
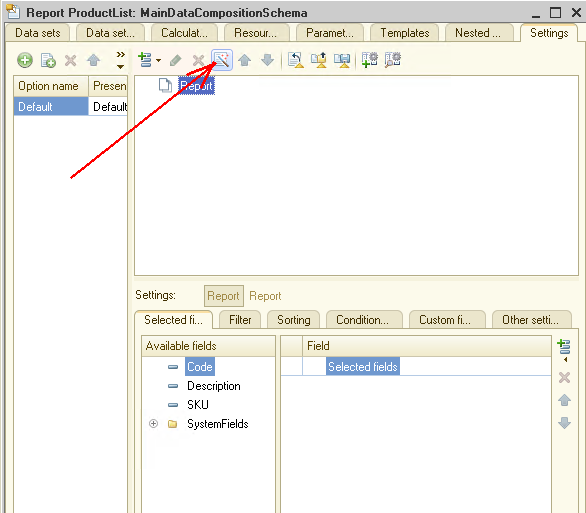
Open Settings wizard on the Settings tab – to do this, click the corresponding button:
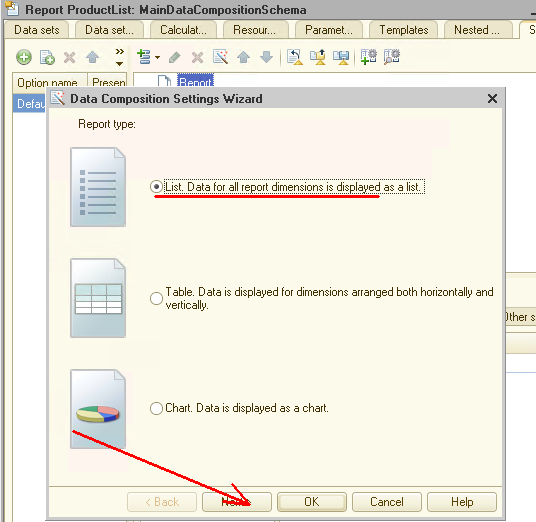
Select the first option and click Next:
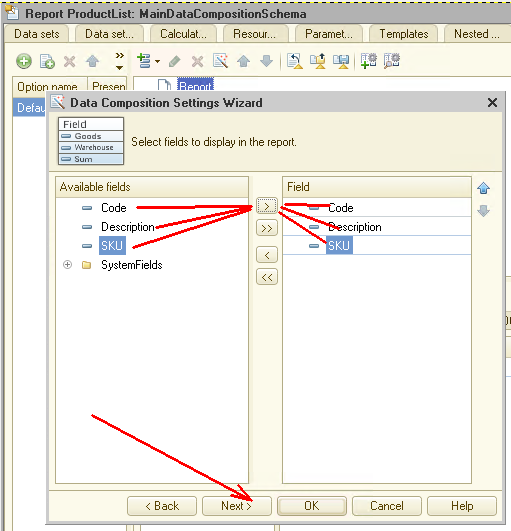
In the next window, select the fields which should be displayed in our report. Then, also click Next:
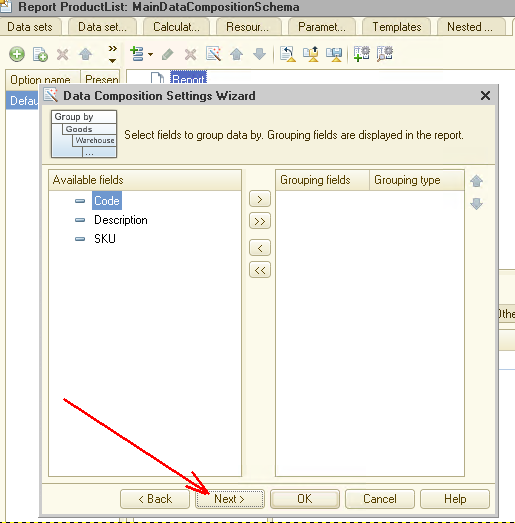
Here we can specify the fields by which the grouping will be realized. Our report will not contain such fields, therefore, do not change anything and click Next:
In the last Settings wizard window, we can specify the fields by which the data will be sorted. Let’s sort by the Code field. After that, click OK and close Settings wizard:
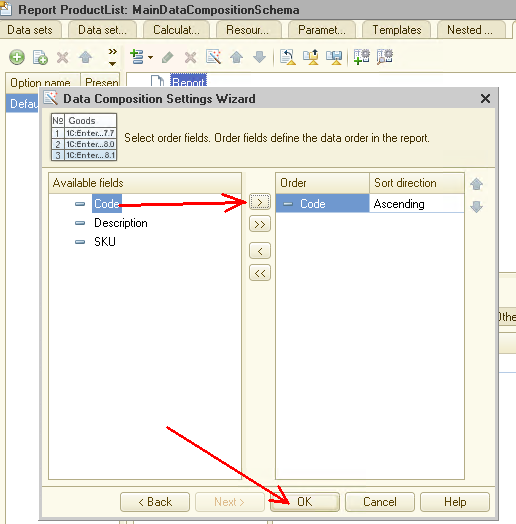
Report creation is completed. It remains only to save it as a file on the computer’s hard disk.
In the main configuration menu, click Save (Ctrl+S). In the opened dialog, we specify the path for saving our report.
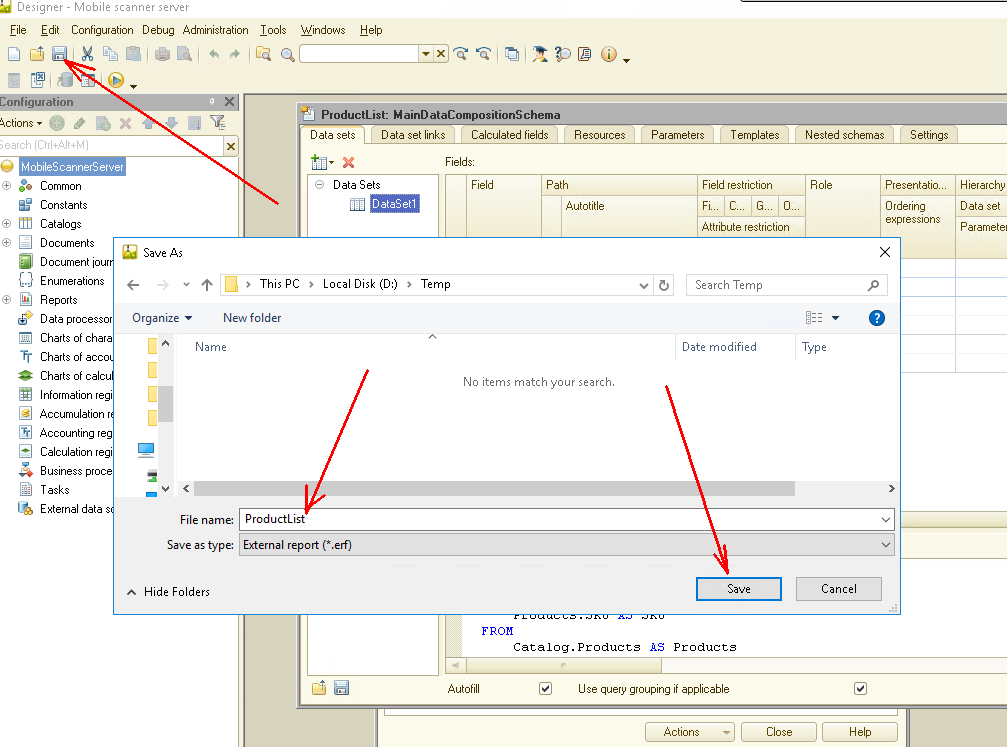
Thus, we save our report to an external file, and now it can be used in this configuration or in another similar one as well. Let’s study how to do this.
But before this, it’s required to give the user the right to use external reports.
Our configuration MobileScannerServer has only one user role – Administrator, and we should turn on the option for assuming this role.
To do this, open the Administrator role properties and check the Interactive open external reports item. Now, users with the Administrator role can open external reports in the user mode.
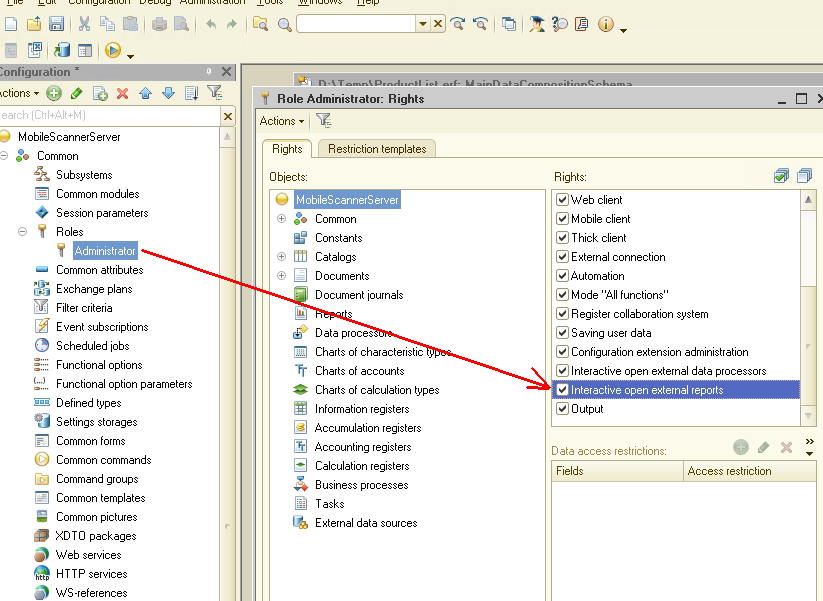
Then, we need to check how our report works.
Run the 1C platform in the user mode. In its main menu, select File -> Open (Ctrl+O):
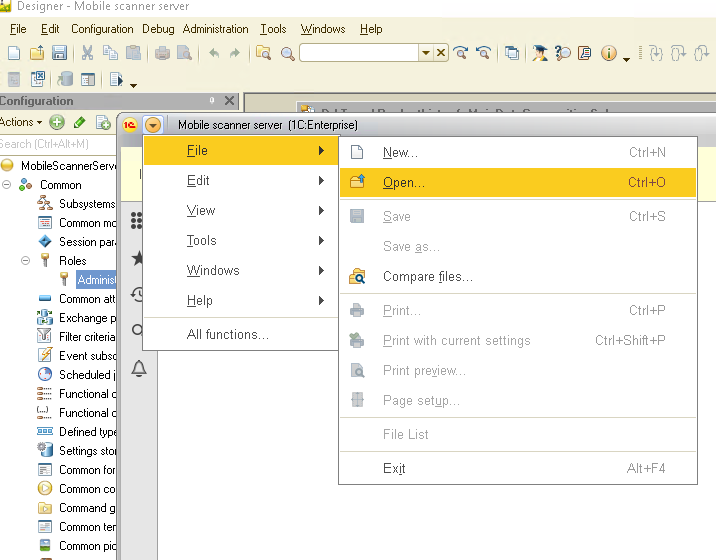
Next, find our report on disk and open it, then click the Run report button. The report is immediately generated and displays the list of all our goods from the Products catalog:
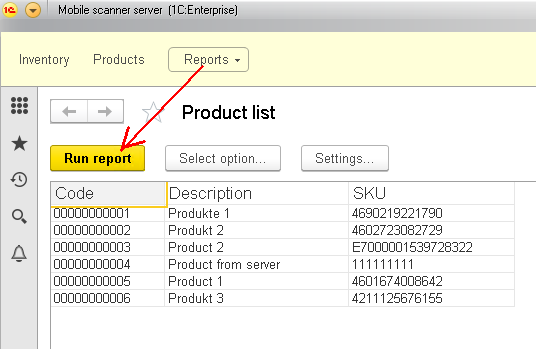
Thus, we get the desirable report. We could say that the task is finished. But let’s complicate things a bit.
For example, we want to output a list of products for which the SKU begins with 46. We will not have to program anything, we can do it using the configuration settings.
In the report, click More actions -> Change option...
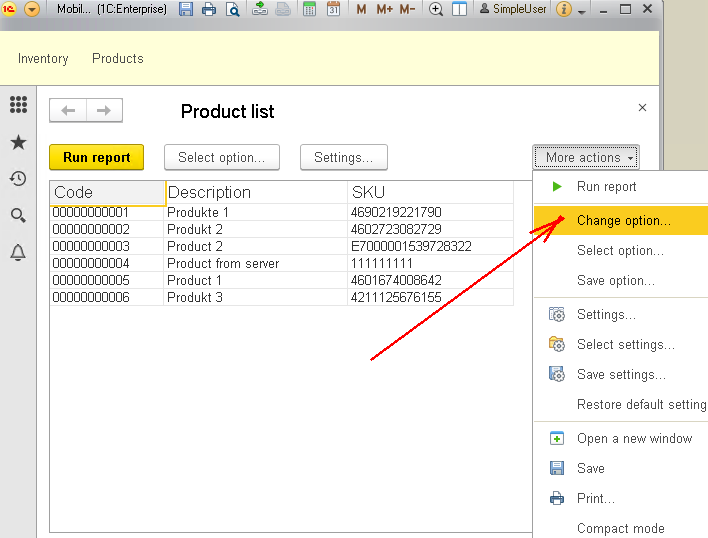
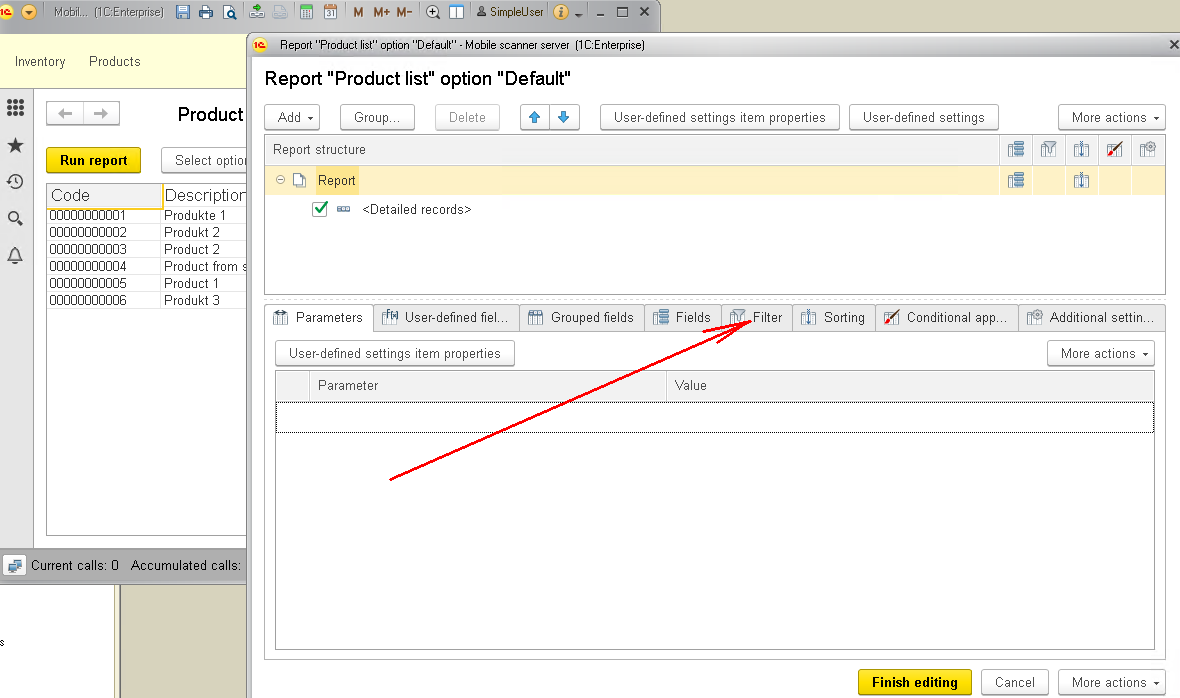
In the opened dialog, we can specify some additional report parameters. Go to the Filter tab:
Right here you can set the filter parameters. Since the filtering will be performed by the SKU field, drag and drop it to the right. Indicate Contains as a Comparison type, and 46 as a Value:
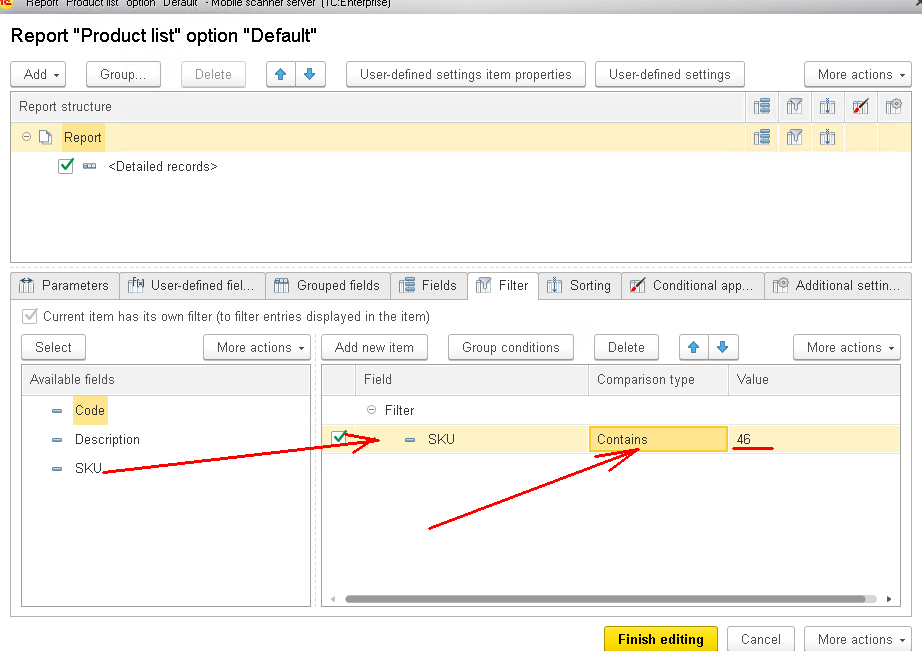
What does this filter mean? The final report will contain all the products for which SKU includes the value 46.
In general, the Comparison type parameter can take several values. This allows creating filters of different complexity if necessary:
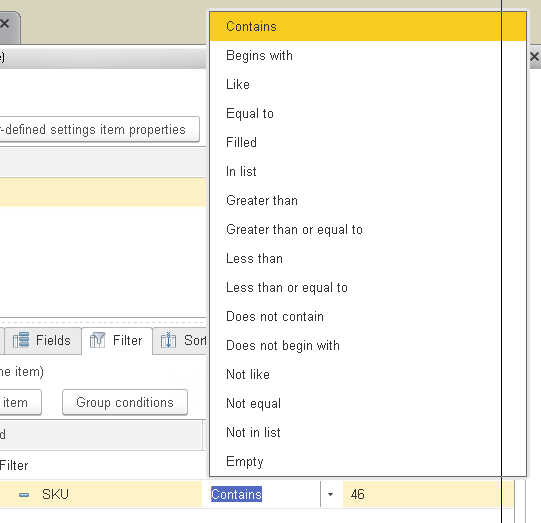
After that, close the dialog of additional report settings by clicking the Finish editing button. In the report form, click Run report in order to re-generate it.
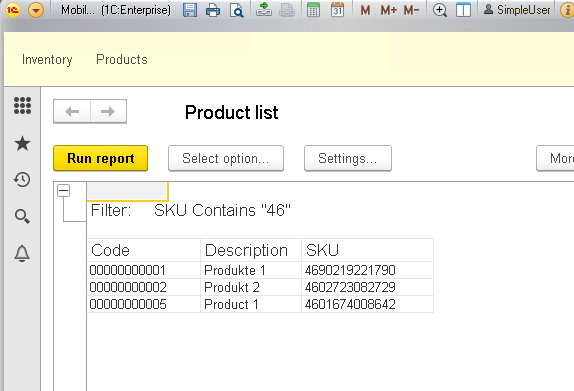
We see that the report displays only those goods for which SKU contains the value 46.
Please, note that we modified our report directly in the 1C user interface. It is exactly here where the power of the Data composition system comes into full play – it’s not necessary to involve developers in the process – the user can independently customize the report and select precisely those data that they need. The programmer should only develop the report basis and give it to the user for further work.
Let’s continue.
The above example is actually very simple. The data composition system is capable to generate far more complicated reports. Let’s create another report, now more complex, which will output a list of all Inventory documents with all Products that are stored inside.
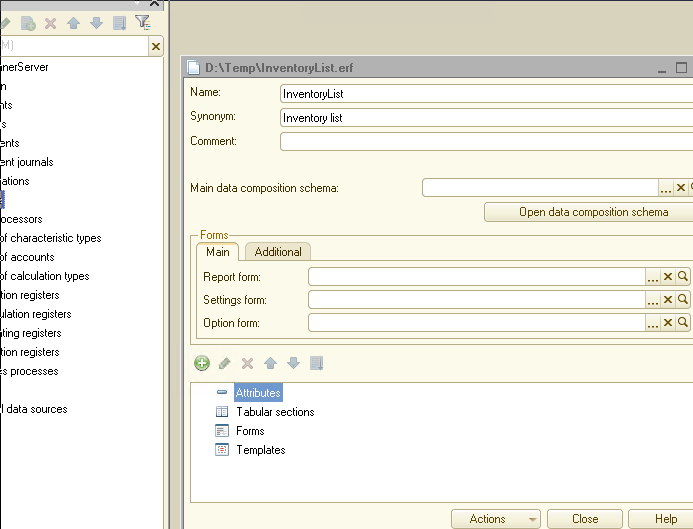
So, we create a new report – InventoryList, and a new Data composition schema:
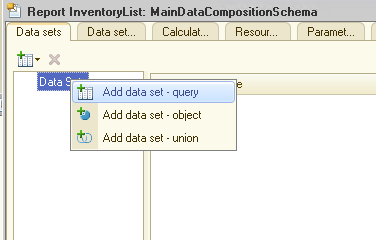
Add Data set – query to the Data composition schema:
and open Query Builder. In the Query Builder window, we compound a query in the following way:
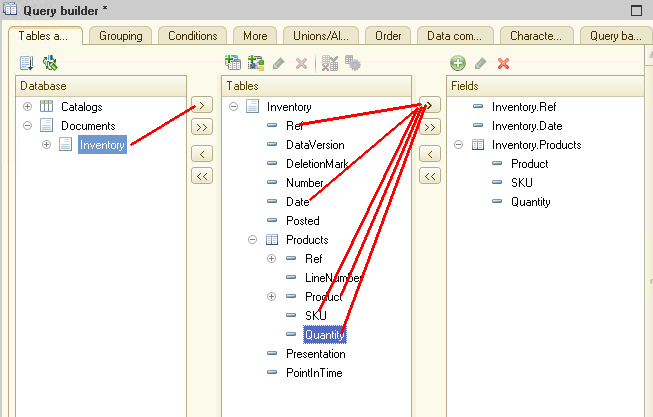
Note, that we select data from both the same document (Ref and Date) and its tabular section (Product, SKU, Quantity).
Next, click OK, return to the Data composition schema window, go to the Settings tab and run Settings wizard:
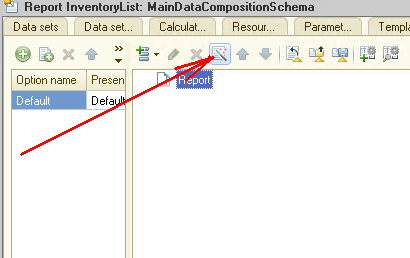
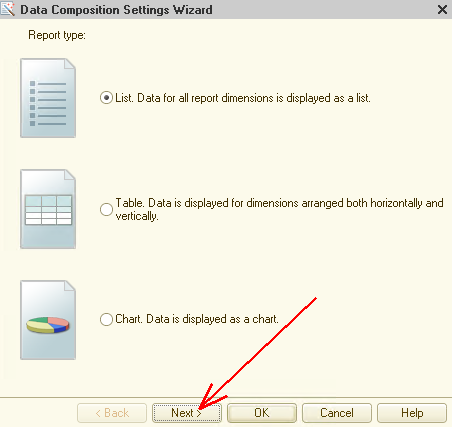
Click Next on the first screen:
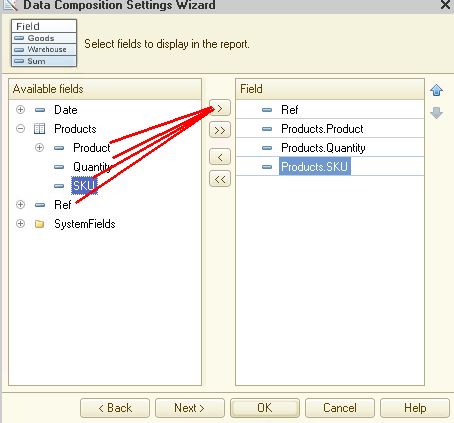
Then, we select the fields that should be displayed in the report. Please, note that we are omitting the Date field, but we will need it later for another goal:
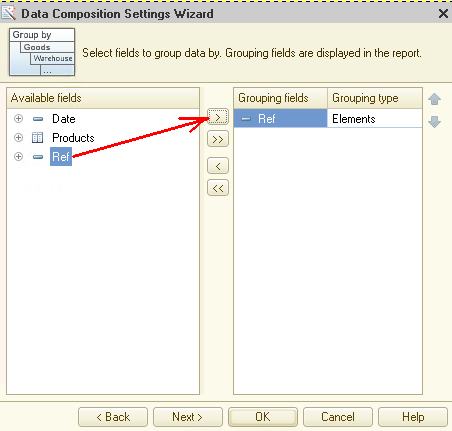
Click Next again and go to the form where we can specify grouping fields. Here we indicate Ref as a grouping field, in other words, data will be grouped by this field. You will see now how it looks in the report:
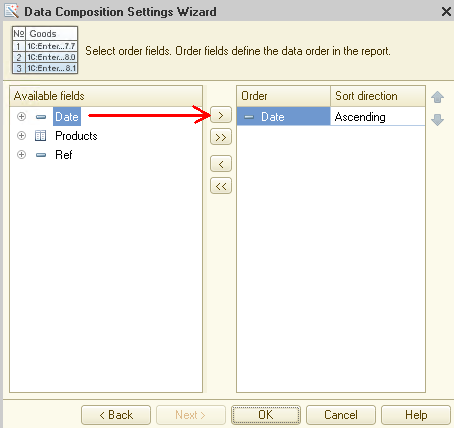
Open the last form by click Next again. Here we specify by which fields the data will be sorted in the report. We will sort it by the Data field:
Then, click OK and return to the Data composition schema:
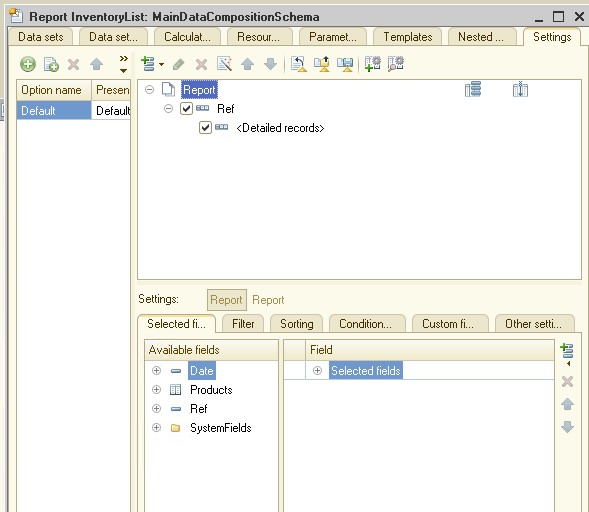
The report is complete! Save it on the disk, launch the 1C platform in the user mode and open our report. Click the Run report button to generate it:
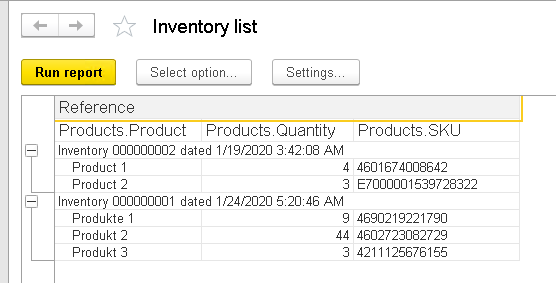
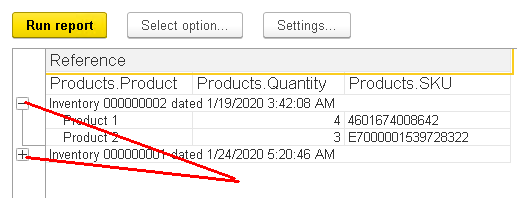
Please, note that the data is grouped by documents. We can, for example, “collapse” some data:
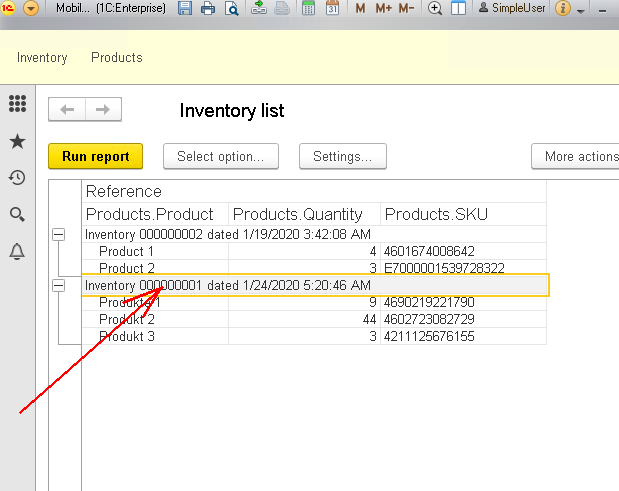
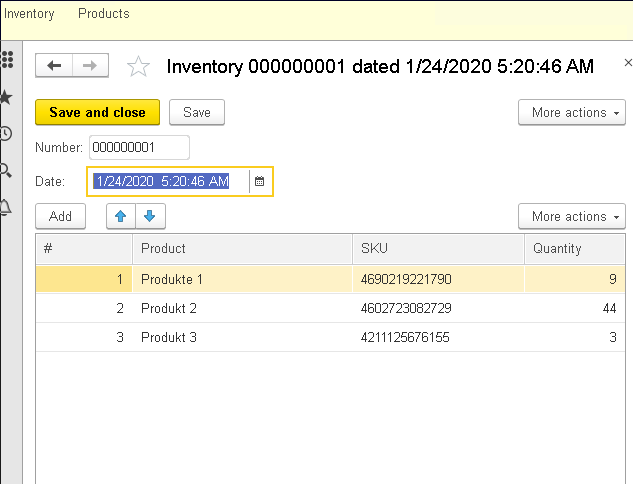
The Data composition schema has one more very useful feature – so-called “decryption”. If we double click the field that displays the Inventory document, the system will automatically open a form for exactly this document. In other words, the user can “fall into” the desirable document directly from the report.
Let’s see how it looks. Double-click:
... the needed document is opened:
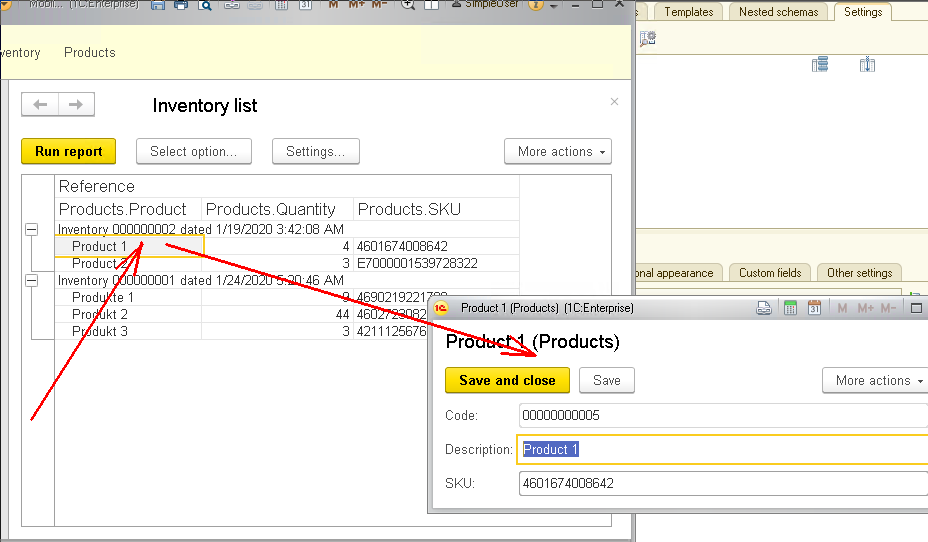
This feature is also available for catalog elements. If we double click the Product field, the form for this item will be opened:
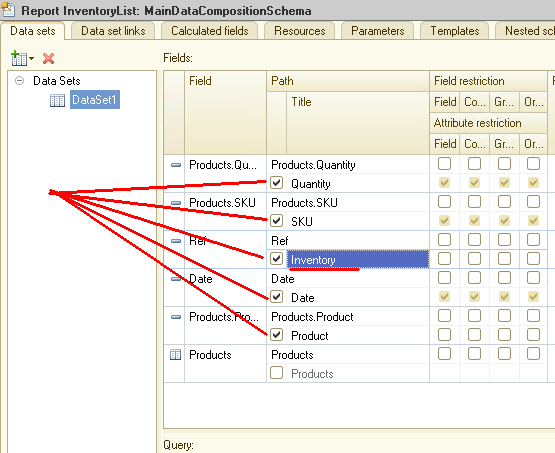
You probably noticed that the report could use a bit of a makeover. For example, the names of the fields in the report do not look very attractive: Products.Product, Products.Quantity, Products.SKU, Reference. Let’s make them more readable...
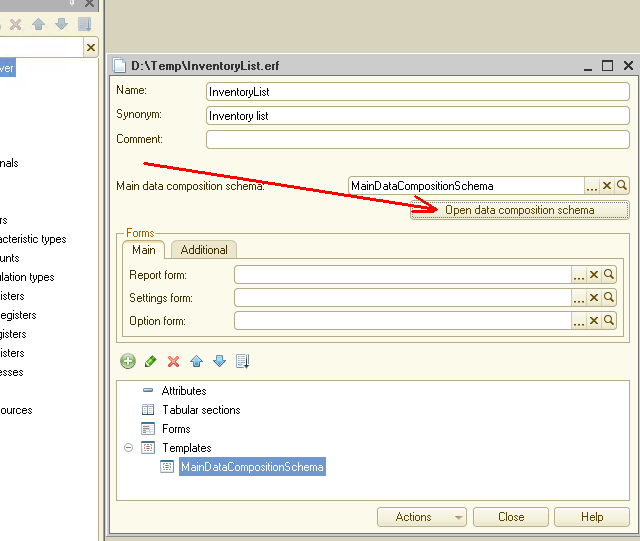
To do this, return to the Designer and open the Data composition schema of our report. We can do it in the following way:
After opening the Data composition schema, we check all the fields the names of which we want to change. For all the fields we leave unchanged the names suggested by the system, but change the name for the Reference field to Inventory:
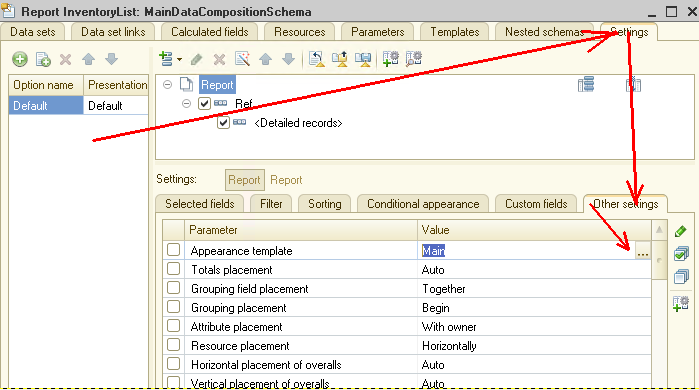
Additionally, go to Settings -> Other settings and select a template...:
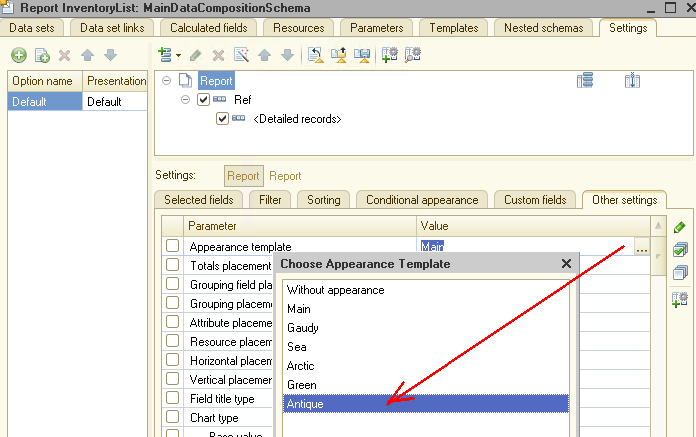
... for example, Antique:
After that, click OK, return our configuration, run 1C in the user mode. Next, generate our report:
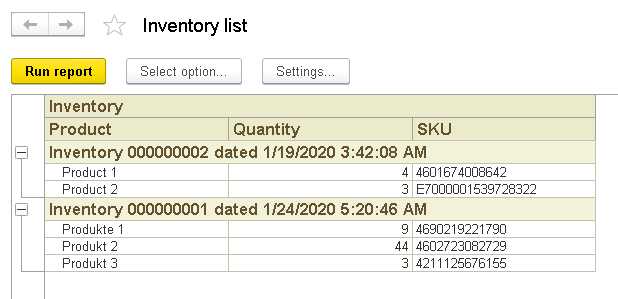
As we can see, the names of the fields have been changed, and the Antique formatting template has been applied to the report.
In the same way, we can change for this report other settings in the user mode, for example, set a filter or sorting method. For this, select the Change option... item:
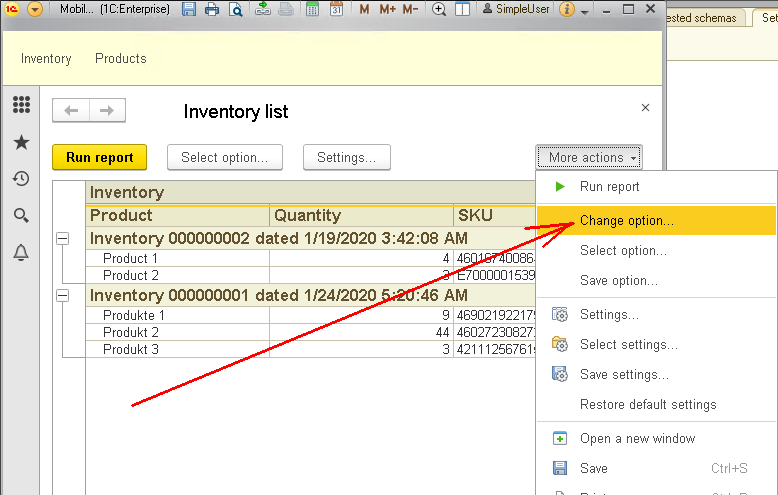
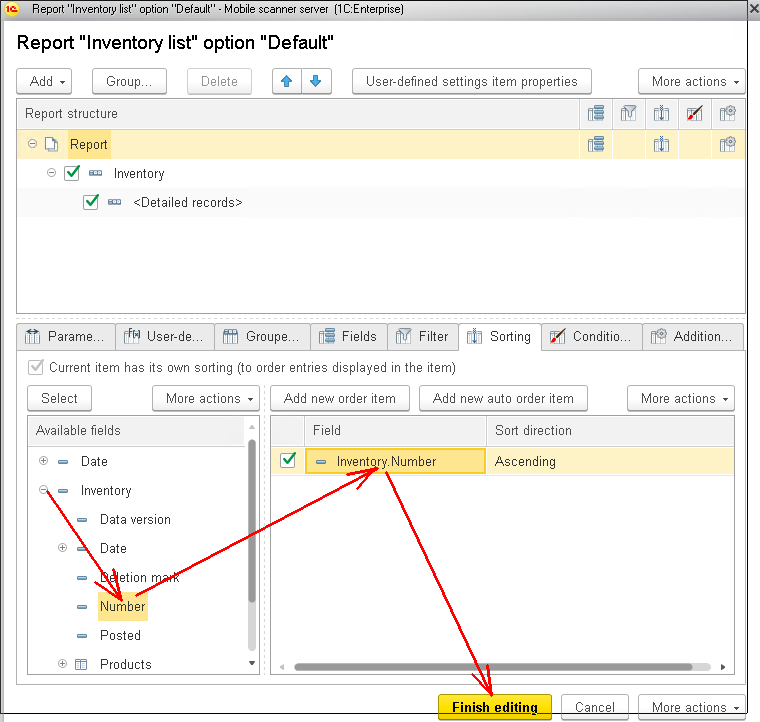
For example, let’s change the document sorting method. If you remember, now the data is sorted by document date in the report – first comes earlier documents. Let’s sort it by document number. In the report settings dialog, go to the Sorting tab:
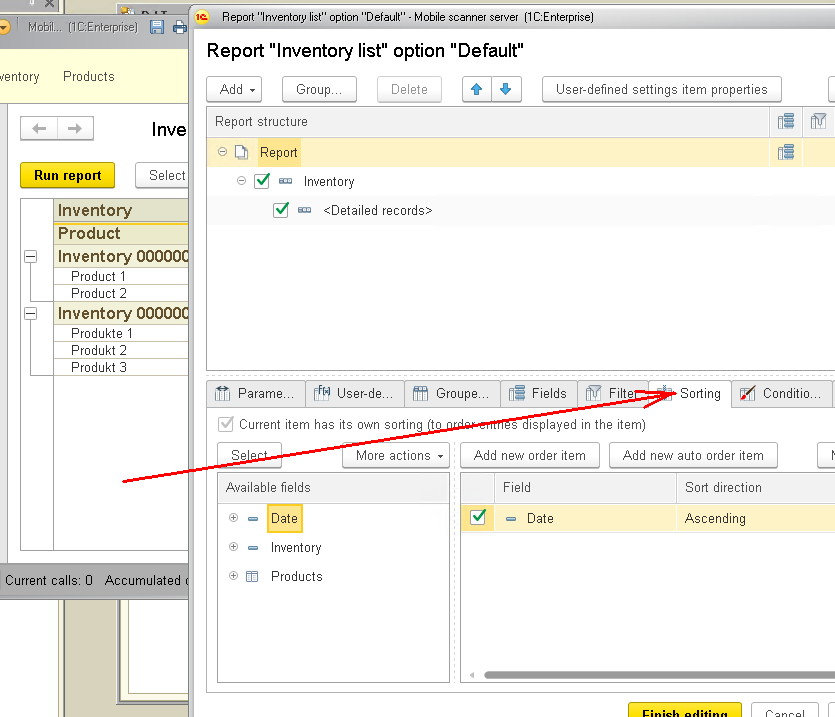
We see that now sorting is by Date in ascending order. Remove the Date field:
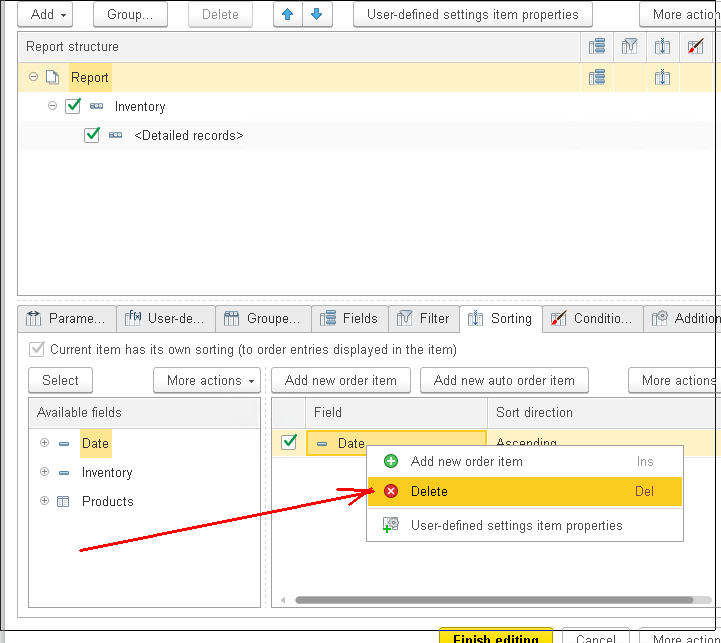
Then, add Inventory.Number as a sorting field and click Finish editing:
Next, click Run report again in our report:
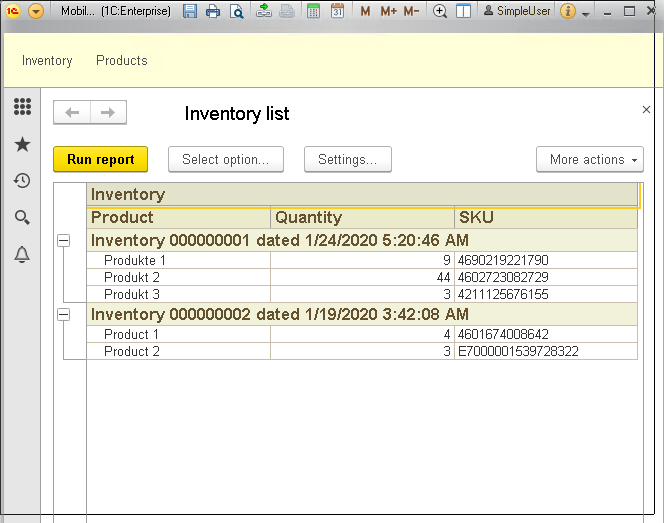
So, as you can see, the documents are sorted by numbers, not by dates. We can assume that the task is solved.
Thus, we created two simplest reports using such the 1C platform as a Data composition schema mechanism.
You can download these reports for your own application.
Please, supplement your suggestions for the development of demo applications in our forum.
Next time, we will implement a feature for sending these reports by email.
Stay tuned, the next tutorial will be even more interesting!


