Debugger is a built-in Designer tool. It is intended for debugging 1C:Enterprise script modules that are created during applied solution development. Debugger provides tools for viewing the order of script operator execution and the variable values.
Main Debugger features
- debugging applications that run on remote computers available by TCP/IP;
- debugging script executed by a working process of a 1C:Enterprise server cluster; a single stack of client and server calls is supported, as well as simultaneous step-by-step debugging of client and server script parts;
- debugging script executed within external connections, background jobs, and WS connections.
Breakpoints
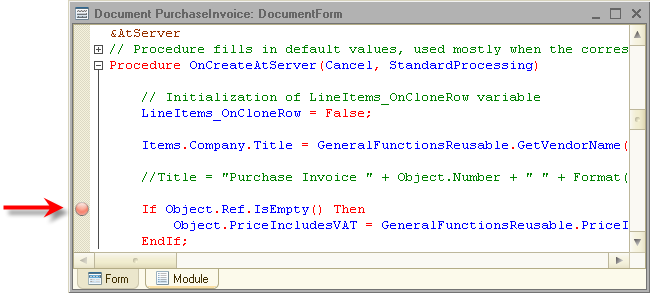
Debugger supports setting breakpoints at specific module lines. On reaching a breakpoint, the script execution is paused and the control is passed to Debugger. Breakpoints can be conditional or unconditional. The module execution is always paused on unconditional breakpoints.
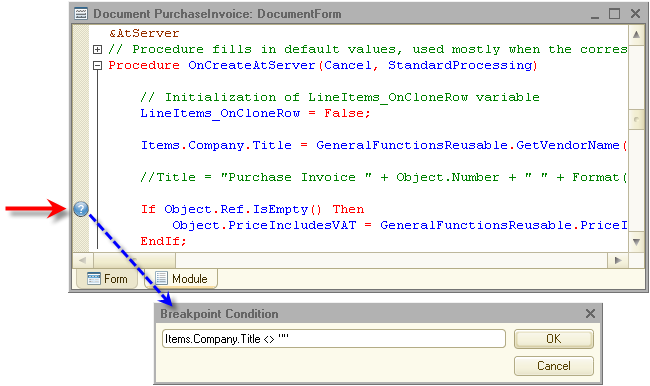
The module is paused on a conditional breakpoint only if the condition is true.
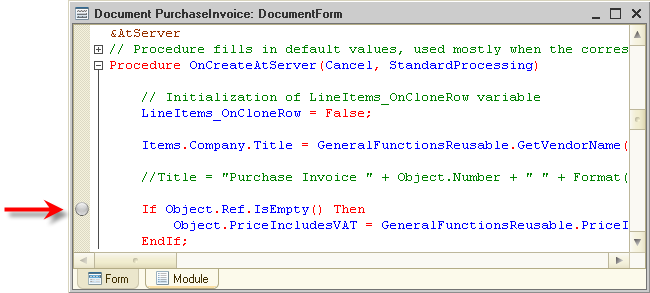
Debugger supports disabling breakpoints. In this scenario, the module line remains marked but this does not affect the module execution in any way.
If an application contains a large number of breakpoints, it is handy to use the window where you can view and edit all of the breakpoints.

Step-by-step execution
Upon reaching a breakpoint, once the control is passed to Debugger, switching to the following execution modes is available: step-by-step execution, function or procedure call, breaking step-by-step execution of a function or procedure, module execution till the line where the cursor is located, or resuming regular module execution.
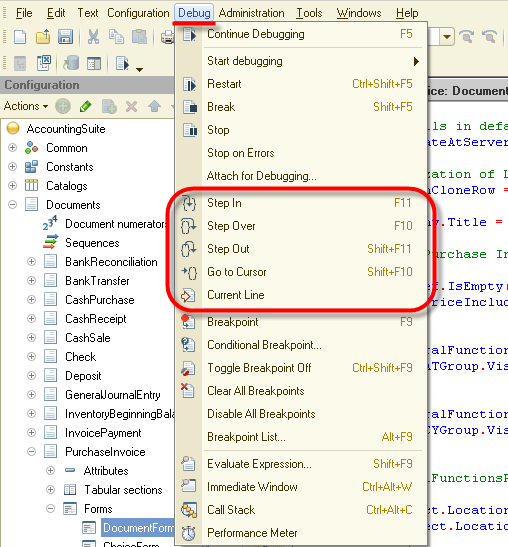
Viewing expressions
During step-by-step execution, you can view the values of module variables, as well as calculate custom expressions while viewing the results in a separate window.
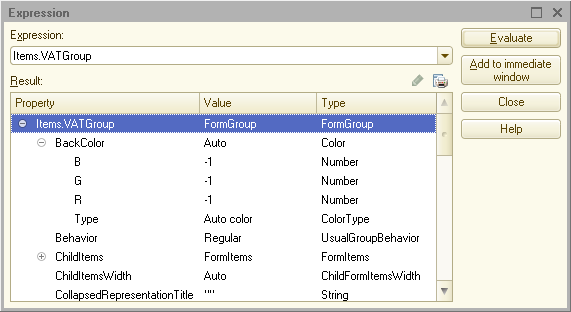
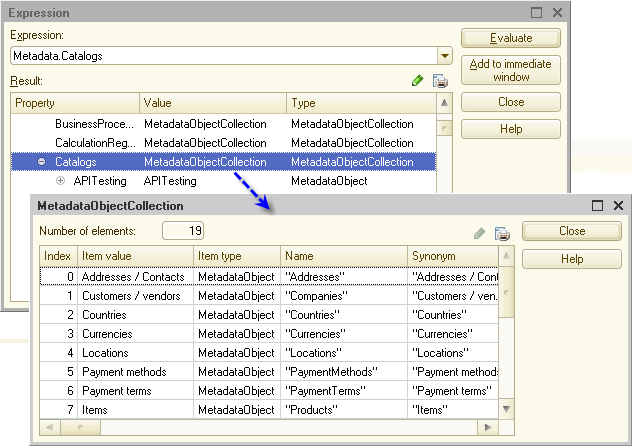
Values of 1C:Enterprise script object properties are represented as a tree. You can also view values of string, array, and value collection types in separate windows.
You can view the current variable value by moving the pointer over the variable name. The current value is displayed as a tooltip next to the variable.
Immediate window
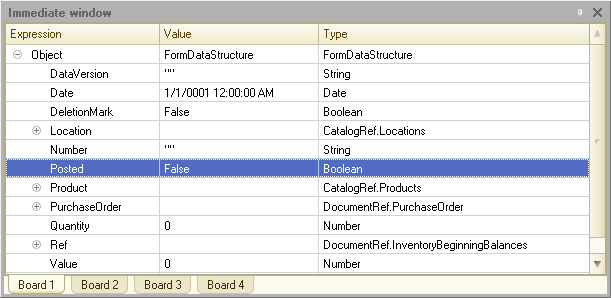
You can view calculated expressions during the execution of some module part in a separate window (immediate window). In this window, you can distribute the expressions being viewed between four tabs.
Call stack
Debugger includes a call stack, which displays the order of function or procedure calls that led to the module line being debugged.

Double-clicking a procedure name in a call stack moves the cursor to the nested procedure call line.
Stop on error
In the "stop on error" mode, the debugging is paused either on each error or on each error whose description includes the specified substring. The list of substrings is specified in the debug settings.
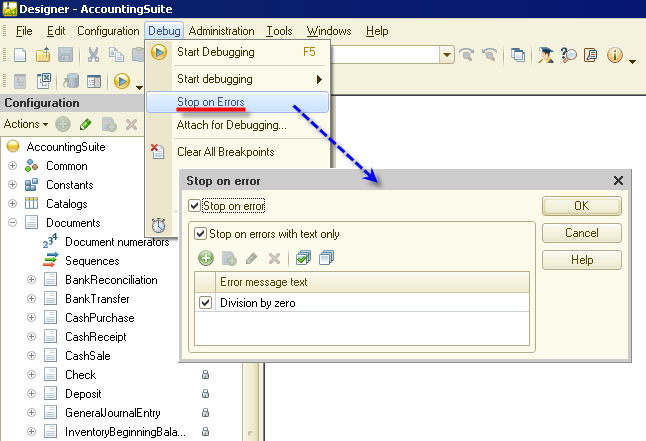
For example, debugging with the settings shown on the figure is only paused when an error related to division by zero occurs.
See also:

