1C:Enterprise developers use Query Console to debug and preview query results. With this data processor, you can debug queries at each development step without the need for launching your application and creating a script to run and process the respective query. Thus, the console helps developers save valuable time.
The Query Console can:
- Retrieve and display data from virtual tables.
- Record query execution time.
- Present query results in a separate window.
To use Query Console, we start with choosing the query we want to check. For example, you can find queries in a data composition schema (DCS) in any report (Fig. 1)
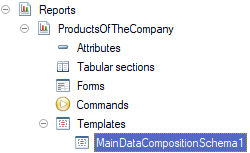
(Fig. 1)
Open a DCS and copy the text of the query you want to check (Fig. 2):
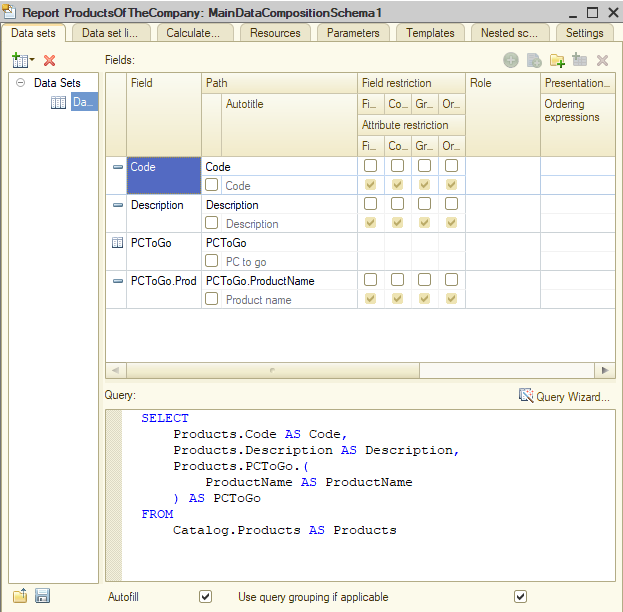
(Fig. 2)
Then, switch to 1C:Enterprise mode and open data processor Download Query Console QueryConsole_en.epf. You already know how to open an external data processor (Fig. 3):
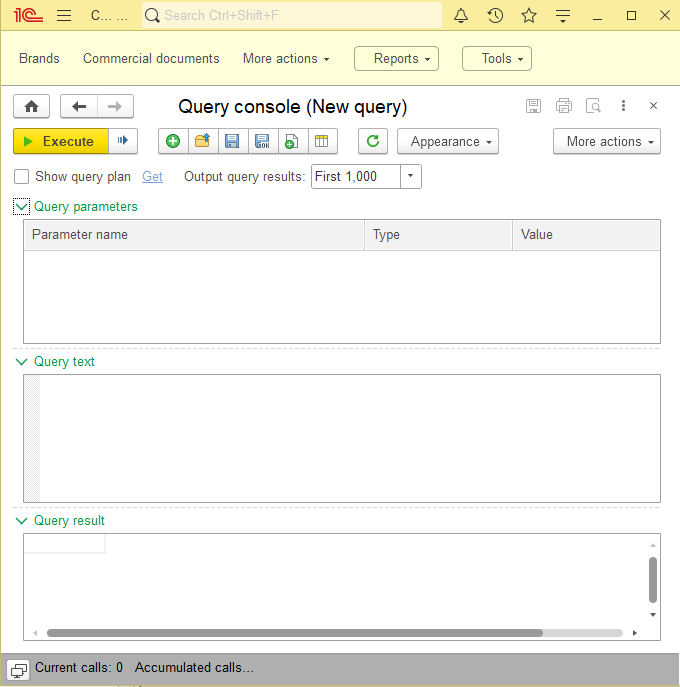
(Fig. 3)
For now, we are interested in Query Text and Query Result sections.
Paste the text of the query in the Query Text section and click Execute (Fig. 4):
SELECT
Products.Code AS Code,
Products.Description AS Description,
Products.PCToGo.(
ProductName AS ProductName
) AS PCToGo
FROM
Catalog.Products AS Products
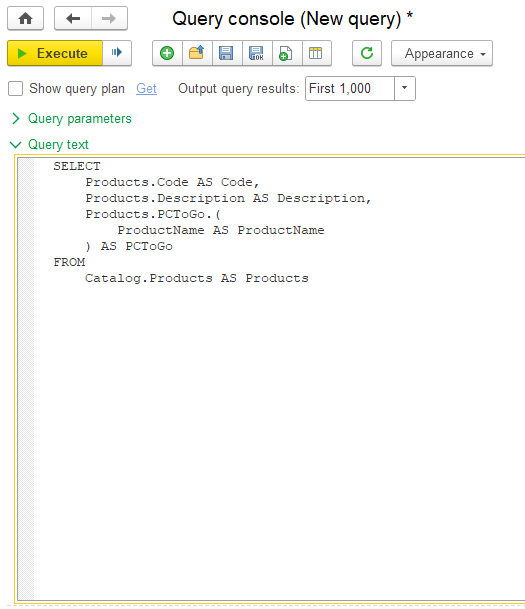
(Fig. 4)
And we get the query check results as a table in the Query Results section (Fig. 5):
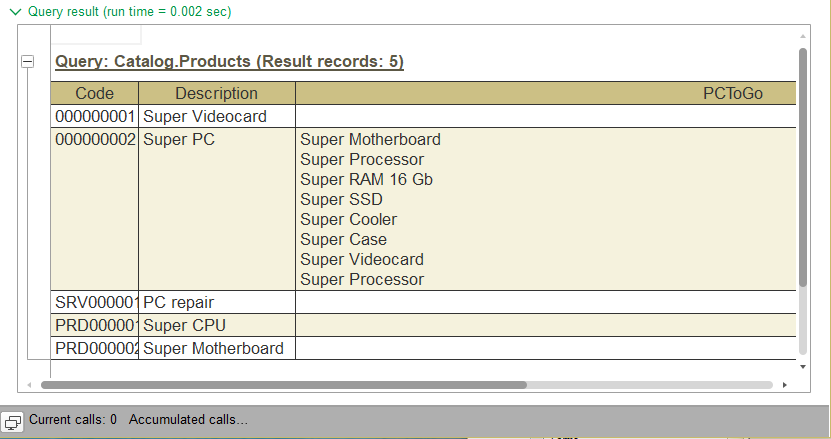
(Fig. 5)
We strongly recommend using Query Console when creating queries.
It really helps and saves plenty of time in development and debugging processes.
Get more details: Downloads