The Data Analysis and Forecasting mechanism is one of the tools to generate economic and analytical reports. It is designed to help users (economists, analysts, etc.) find non-obvious patterns in the data accumulated in information databases. With this mechanism, we can:
-
Search for patterns in the raw data stored in an infobase;
-
Manage analysis parameters either via code or interactively;
-
Access the analysis result via code;
-
Automatically display the analysis result in a spreadsheet document;
-
Create forecast models that automatically predict subsequent events or the values for specific characteristics of new objects.
The data analysis mechanism is a collection of the 1C:Enterprise language objects able to interact with each other that allows developers to use the components in any combination in any software product. Built-in objects make it easy for developers to enable users interactively configure analysis parameters. Also, thanks to the built-in objects, it is possible to display the analysis result in such a convenient form as a spreadsheet document.
The mechanism allows working both with data received from an infobase and with data obtained from an external source, previously loaded into a table of values or a spreadsheet document:
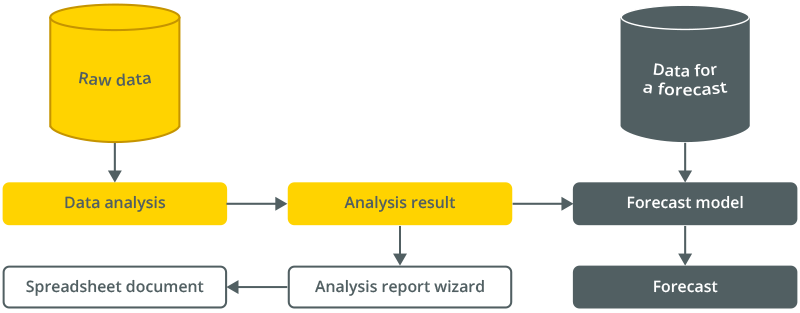
By applying one of the analysis types to the raw data, we acquire the analysis result. Such a result is a specific model of data behavior. We can display the result in a document or save it for future use.
By future use of the analysis result, we mean the ability to create a forecast model that predicts the behavior of new data per the existing model.
For example, we can analyze which items are purchased together (on the same invoice) and store the analysis result in a database. Later on, when creating the next invoice, we can use the saved analysis result to build a forecast model, feed the new data contained in this invoice into it, and get a forecast on the goods Mr. Prescott, J.M. is likely to purchase if they are offered to him:

The Data Analysis and Forecasting mechanism supports several types of data analysis:
Supported Types of Analysis
General Statistics
It is a mechanism for collecting information about the data included in an analyzed result set. This type of analysis is intended for a preliminary study of the data source.

The analysis shows several characteristics for fields with contiguous or discrete values. Fields with contiguous values have types Number and Date. For all other types, we use fields with discrete values. When a report is displayed in a spreadsheet document, the platform generates pie charts that illustrate the composition of the fields.
Association Search
This type of analysis identifies frequently occurring groups of objects or characteristic values and searches for association rules.
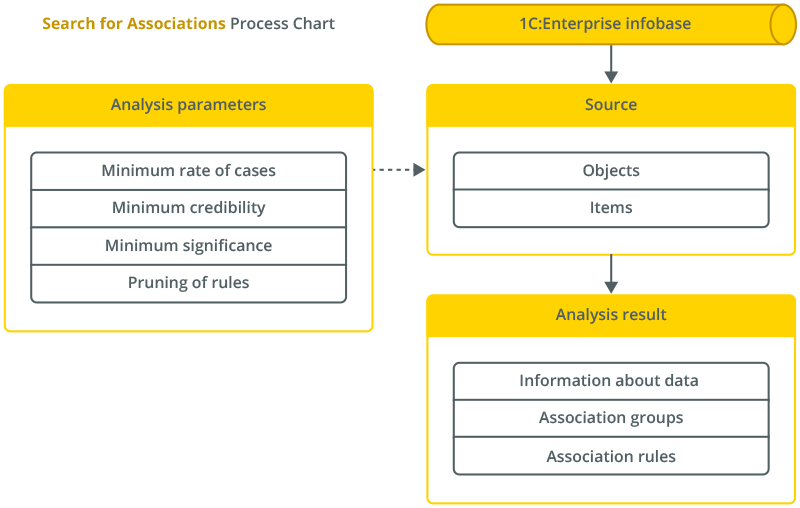
The association search can be helpful, for example, in identifying goods or services frequently bought together.
This type of analysis can work with hierarchical data, allowing, for example, to discover rules that apply to specific products and their groups. An essential feature of this type of analysis is the ability to work both with object data sources, where each column contains some object characteristic, and with event sources, where object characteristics are stored within a single column.
To facilitate the perception of the result, the platform utilizes a mechanism for cutting off redundant rules.
Sequence Search
The sequence search type of analysis allows identifying sequential chains of events in a data source.
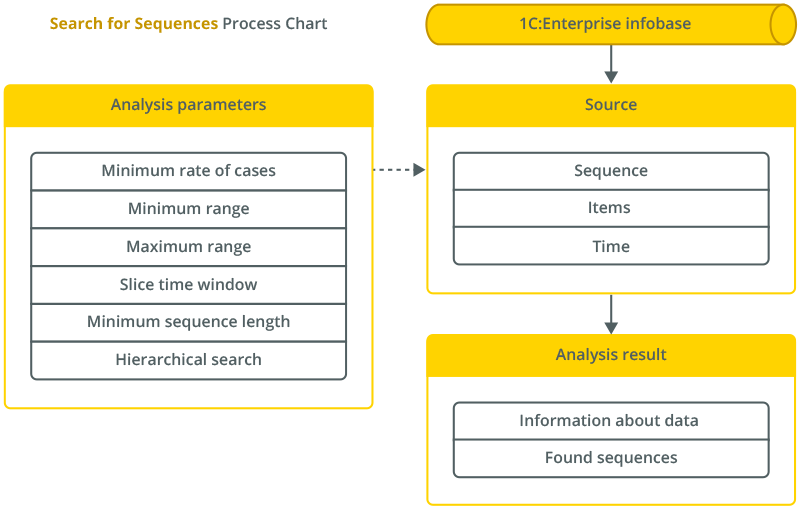
For example, it can be a chain of goods or services that customers often purchase in succession.
This type of analysis allows us to search through the hierarchy, which makes it possible to track not only the sequences of specific events but also the sequences of parent groups.
By specifying analysis parameters, users can limit the time distances between the elements in the desired sequences and adjust the accuracy of the results.
Cluster Analysis
With cluster analysis, we can divide the initial set of objects under study into groups of objects so that each object is more similar to the objects from its group than to those of other groups. Then, analyzing the resulting groups called clusters, we can determine what characterizes a particular group and decide on the methods of working with objects of different groups.
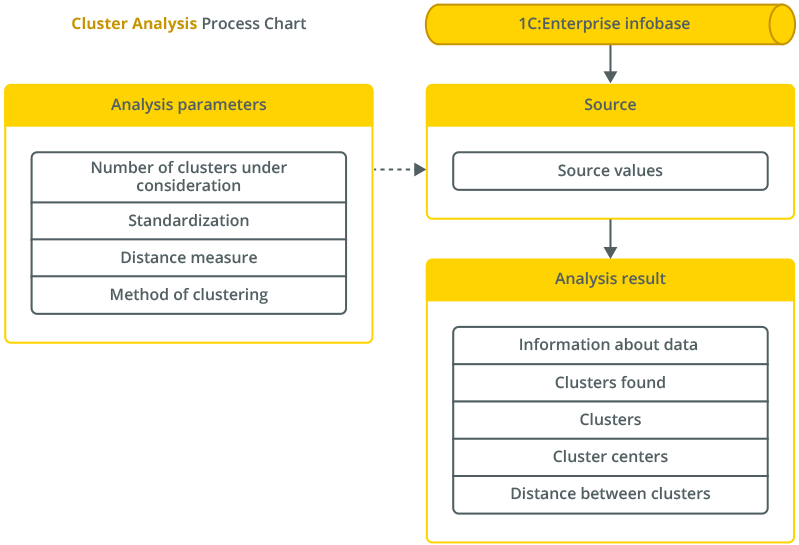
For example, using cluster analysis, we can divide company clients into groups to apply different strategies when working with them.
With cluster analysis parameters, analysts can set up algorithms for partitioning data, dynamically change the composition of the characteristics taken into account in the analysis, and set up weight coefficients for them.
The result of clustering can be displayed in a dendrogram, a special object designed to display sequential relationships between objects.
Decision Tree
The decision tree type of analysis makes it possible to build a hierarchical structure of classifying rules presented as a tree.
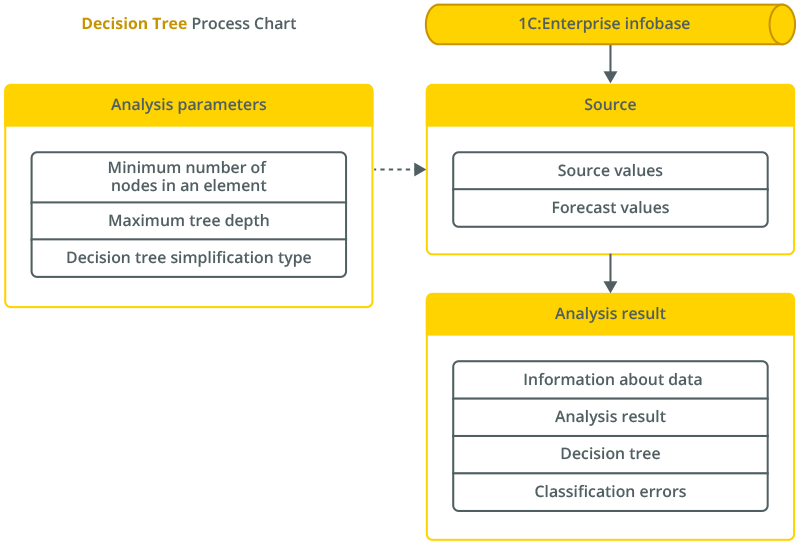
To build a decision tree, we select the target attribute as a basis for our classifier, plus several input attributes to be used to create rules. The target attribute may contain, for example, information about whether the client switched to another service provider, whether the transaction was successful, whether the work was done well, etc. Input attributes can be, for example, the employee's age, work experience, the financial shape of the client, the number of employees in the company, etc.
The result of the analysis is represented as a tree, where each node contains a specific condition. To decide which class a certain new object should be assigned to, it is necessary to go through the chain from the root to the tree's leaf by answering questions at the nodes. An affirmative answer picks the child node, and a negative one results in a switch to the neighboring node.
Forecast Models
The forecast models produced by the mechanism are special objects created based on the result of data analysis and make it possible to draw up forecasts for new data in the future automatically.
For example, an association search prediction model built per the analysis of customer purchases can be used when working with purchasing customers to offer them products they will likely pick together with already chosen products.