As 1C:Analytics is a part of 1C:Enterprise 8, there is no need to create other accounts and assign access rights.
Switching between the accounting system and 1C:Analytics is as easy as a couple of mouse clicks.
A clear and easy-to-read interface is aimed at business users and requires neither special training nor previous experience with 1C products.

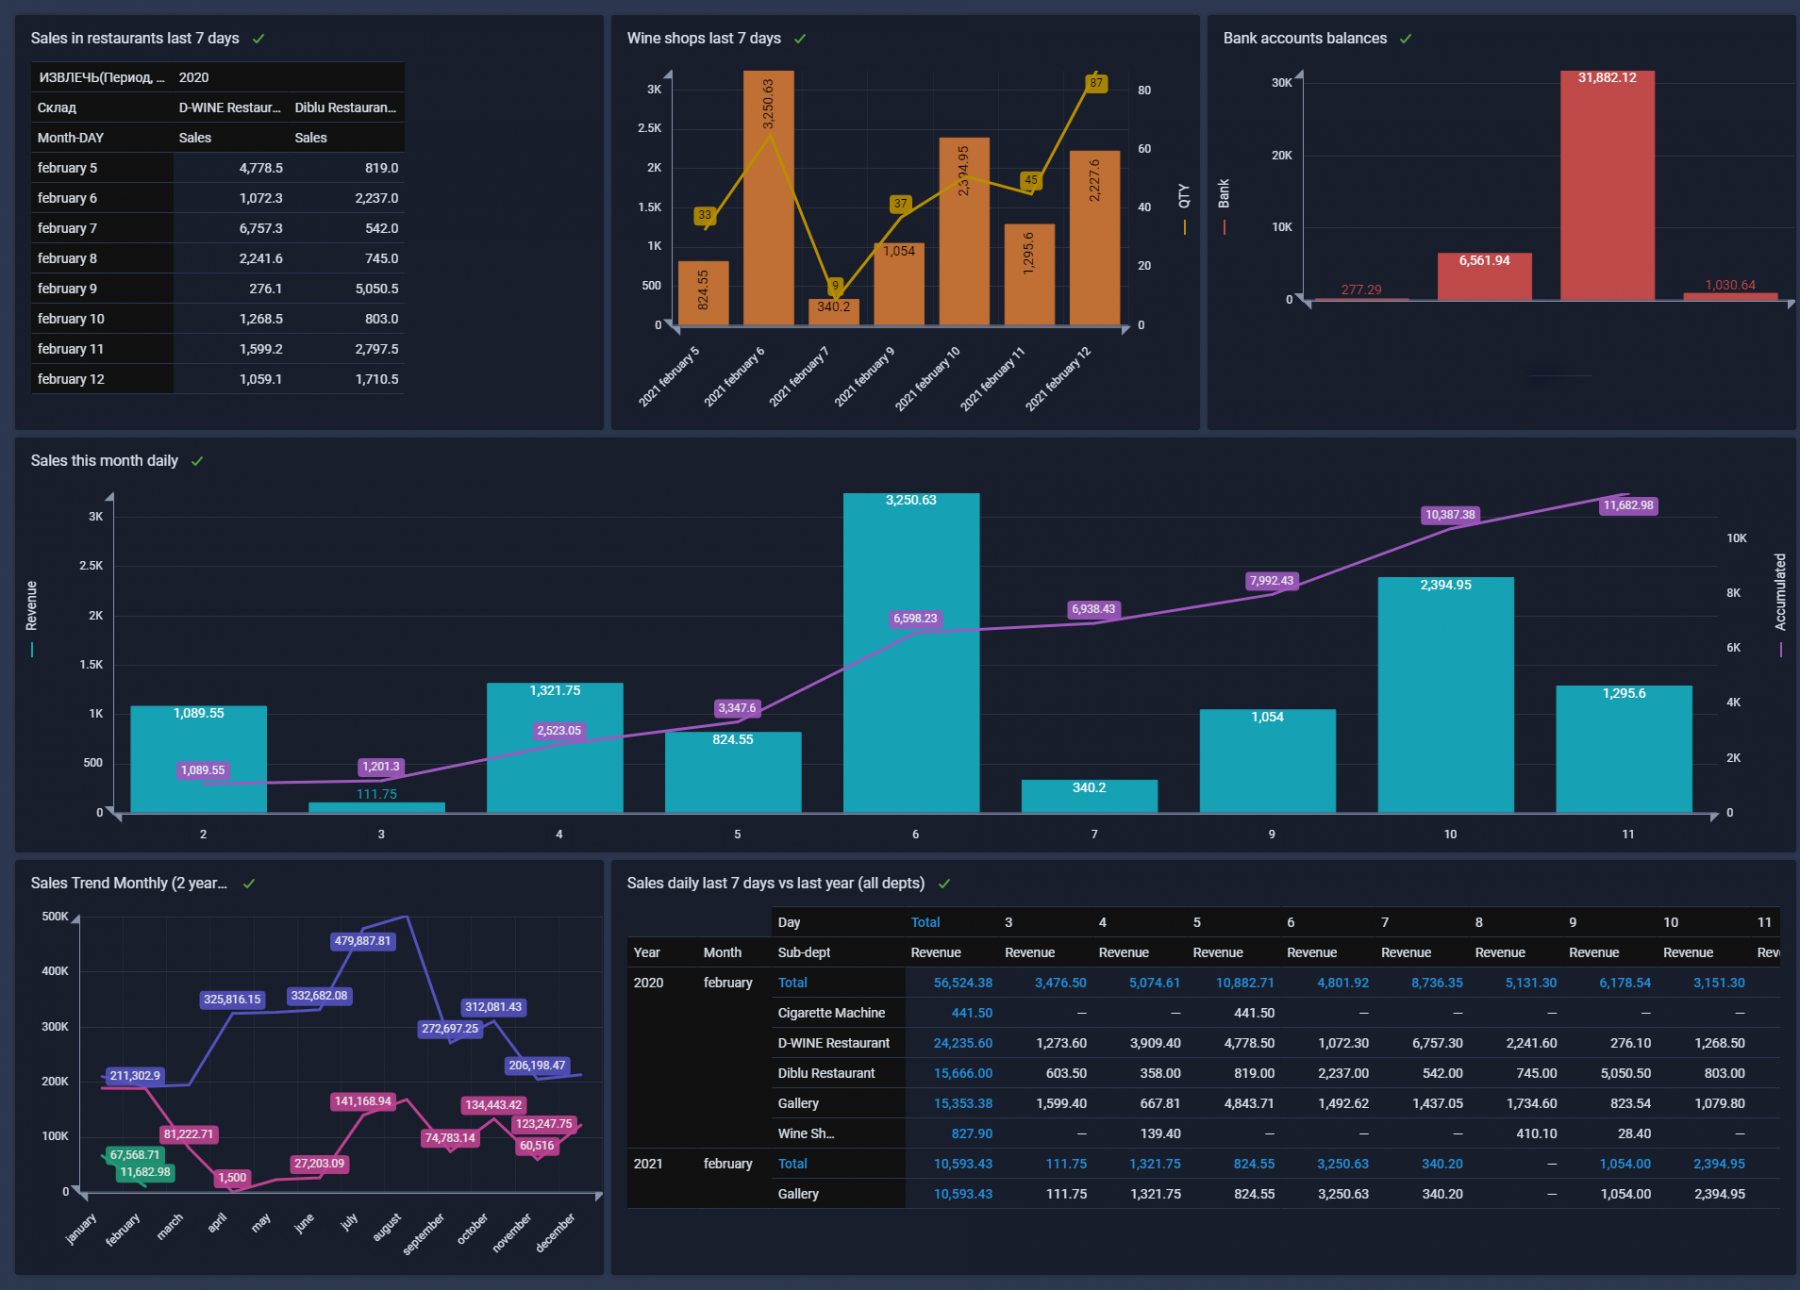
- Start Screen to search available diagrams and dashboards or create new ones.
- Diagram Editor to check current diagrams, adjust views, set up filters and diagram types.
- Dashboard Editor to select diagrams included in the dashboard, change the layout, apply group filters, and open diagrams available on the dashboard.
1C:Analytics is a quick and easy tool to generate summarized reports on data accumulated in registers or documents and then dive deeper into a specific form or catalog item if needed.
All data in 1C:Analytics diagrams are linked to documents or information database objects and can be easily opened for editing or thorough check.
Being an interactive tool 1C:Analytics fully supports 1C:Enterprise 8 data representation modes (hierarchy of elements in catalogs is a good example) and can present data the way you need it.
1C:Analytics perfectly runs both on desktop computers and mobile devices.
Currently, Android and iOS are supported.
The application accesses data directly and does not require any conversion or extra processing with a 3-rd party software.
Everything happens right inside your system built on 1C:Enterprise 8 platform.

