The performance meter mode is intended for estimating the performance of the entire configuration or a configuration part. In this mode, the usage frequency of specific script fragments and their execution time are measured.
The detailed analysis of the collected data helps to find optimal algorithm implementation methods and therefore increase the application performance.
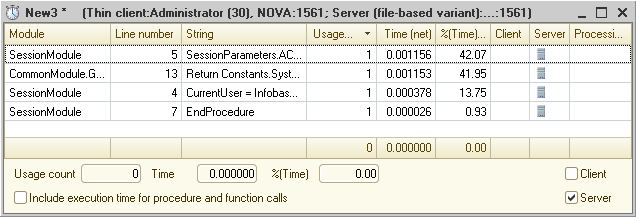
The performance meter result is a list of references to script lines. For each reference, the number of executions and execution time (shown as an absolute value and as a percentage of the total execution time of the script fragment whose performance is being measured) are displayed. The list also shows whether the script lines are executed on the client or on the server, and whether they initiate server calls.
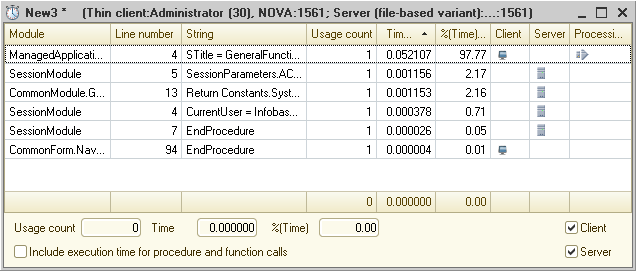
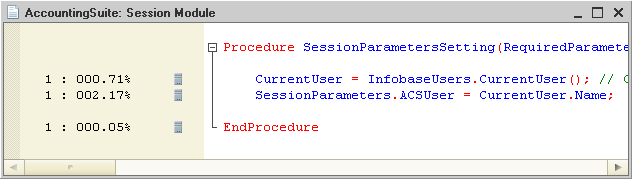
Measurement results can be viewed in the module window. Clicking a line opens the module text where the call counts and execution time percentages are displayed in an additional pane.
You can filter measurement results by call location (client, server, or both), as well as sort them by any column (for example, by a number of calls).
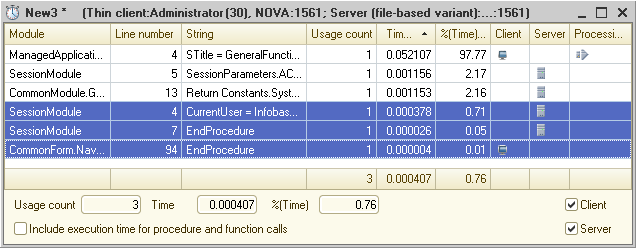
The performance meter features calculating total amounts for selected lines.
Additionally, you can include procedure and function calls in performance measurement, or exclude them. This gives a more accurate picture when external procedures are called from the module whose performance is being measured.
You can save performance measurement results to a file for further analysis and comparison with other measurement results.
See also: