Charts are common objects in the 1C:Enterprise language. They are part of the mechanism for generating economic and analytical reports.
These objects are designed to display data in the form of charts of various types. We can put them in spreadsheet documents or forms (for example, report forms).
These charts are interactive and support the mechanism of providing details. Users can get detailed information or even generate a new report by clicking on the desired chart indicator.
The platform has several objects that can present data as a chart, including:
-
Charts
-
Gantt charts
-
Dendrogram charts
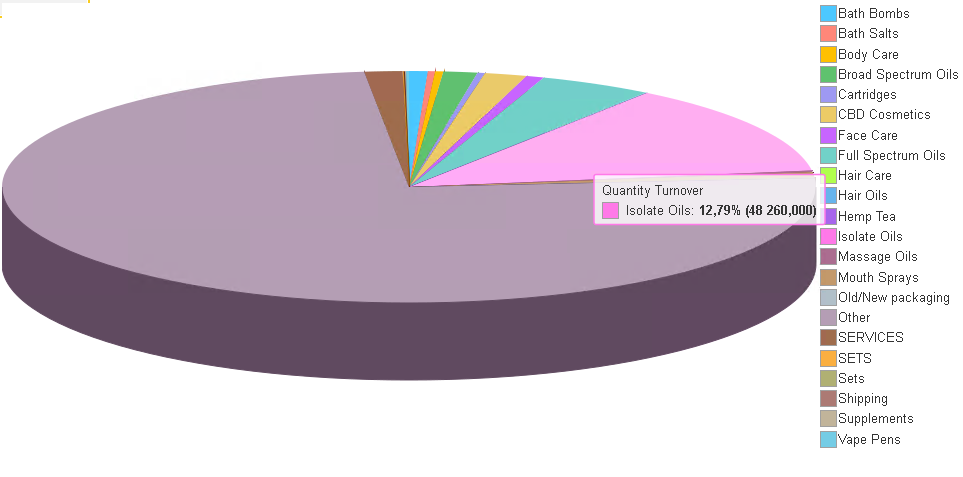
Chart
It is a "universal" object that allows displaying statistical data in the form of charts of various types: graph, histograms, isometric, pie, stock-market, etc.
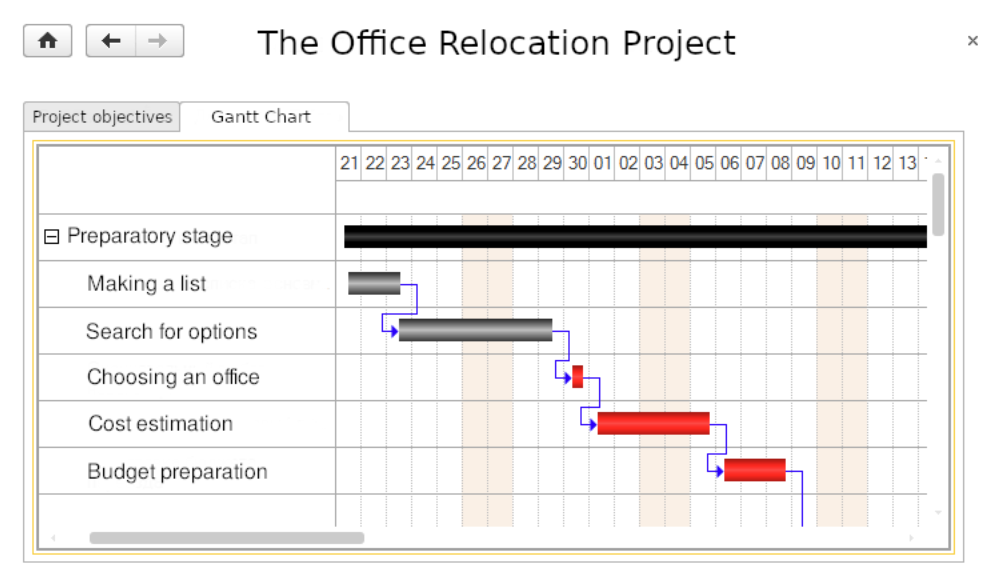
Gantt chart
A Gantt chart, also known as a tape chart, contains a set of intervals located on the time axis and reflects the use of resources (series) by objects (points).
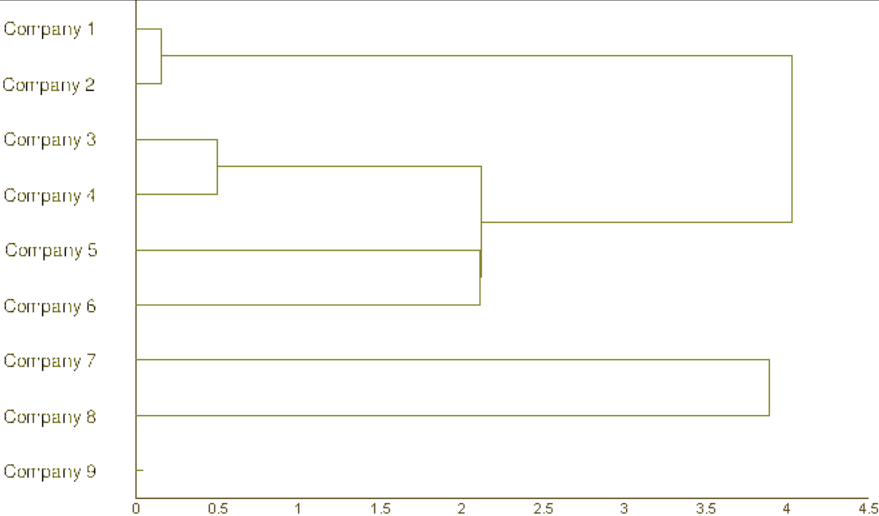
Dendrogram chart
A dendrogram chart is a special-purpose chart most often used to visualize cluster analysis results.