You might ask the right question: "Do I have to open the report Designer mode each time when I need to change its view settings?" After all, the user might not be able or allowed to use Designer mode, for example, when connecting through HTTP protocol. The answer is no, you do not have to use Designer mode each time you need to change something in the report settings. Most of the report settings, including view settings, can be changed in 1C:Enterprise mode without engaging a developer.
As an example, you will change the Expenses report. The default view of the report, meaning the settings that the developer made for it, is as follows:
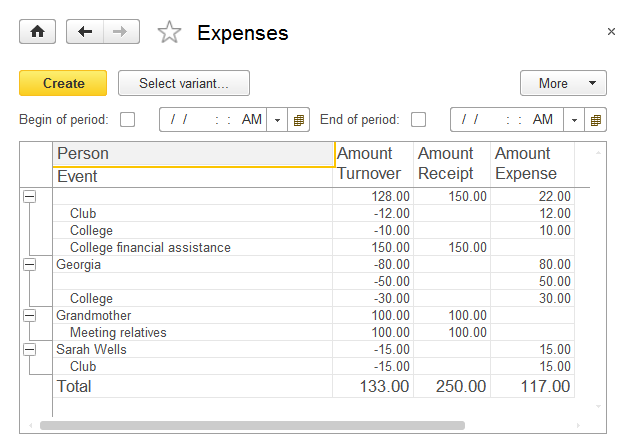
Figure 8-71. The Expenses report with default settings
Imagine that a chart would be easier for the analysis, so you need to change the report into a chart. Click More and then click Change variant...
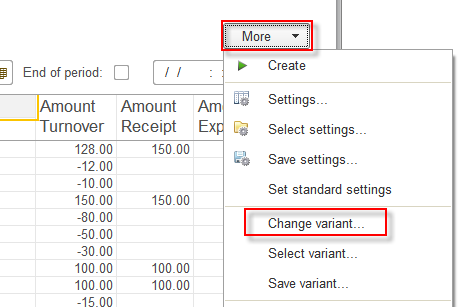
Figure 8-72. Changing a report variant
You will see the report settings window, the same as you used in Designer mode when configured the data composition schema for this report. The default settings are displayed. The one that you have configured in Designer mode for this report.
Click the Person node, and then click Delete (Del) to delete these settings. Confirm the deletion when the dialog appears.
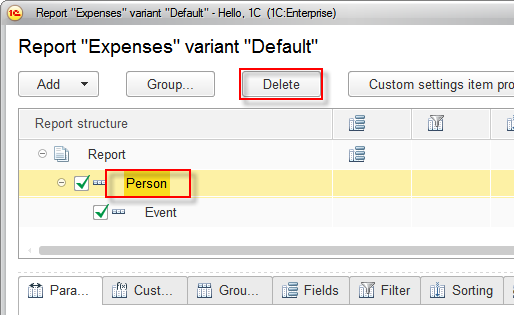
Figure 8-73. Deleting settings of the current variant
After that, right-click the Report node, and in the context menu click New chart.
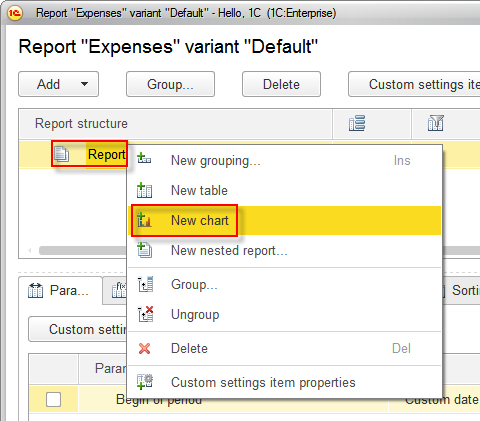
Figure 8-74. Creating a chart
Next, right-click the Points node, and in the context menu click New grouping... In the opened window, select the Event field.
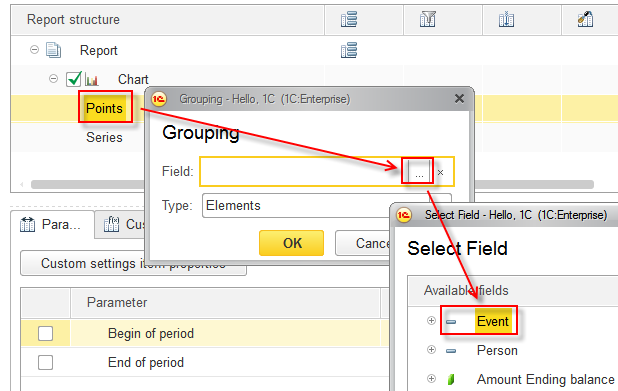
Figure 8-75. The Event grouping field
Then, right-click the Series node, and in the context menu click New grouping... In the opened window, select the Person field.
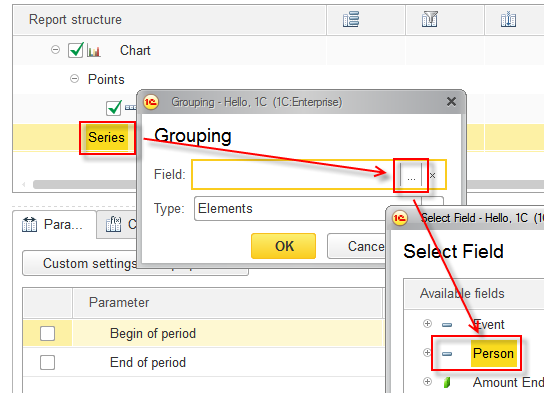
Figure 8-76. The Person grouping field
Now, click the Report node, then click the Fields tab.
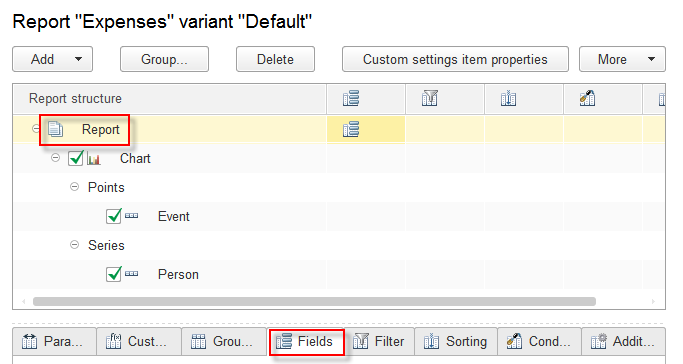
Figure 8-77. Report fields
On the Fields tab check that the Amount Turnover field is placed right after Person and Event fields. In addition, check boxes on the left from Amount Receipt and Amount Expense fields are cleared.
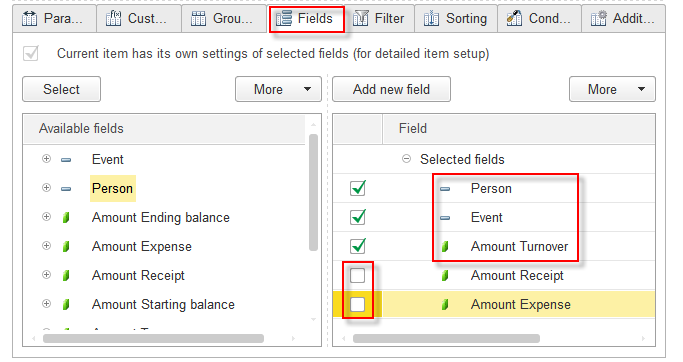
Figure 8-78. Selected fields of the report
Now click the Additional settings tab and for the Chart type property select Bar Graph.
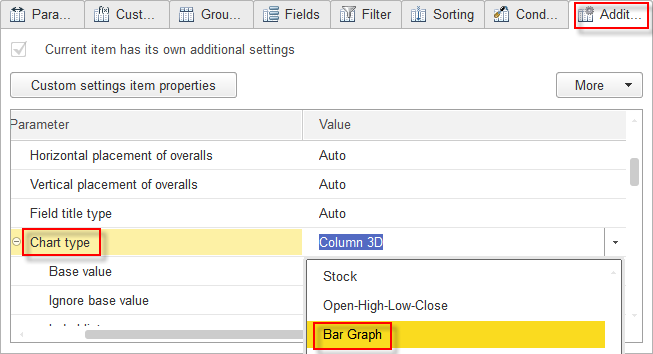
Figure 8-79. Selecting the chart type
Click Finish editing, to save and close the report editor
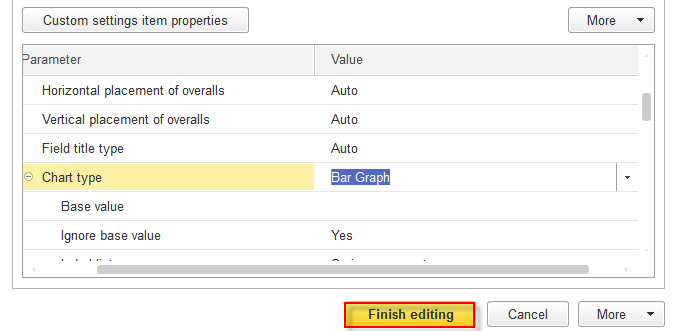
Figure 8-80. Saving the report settings
In the report window, click Create and see how dramatically the appearance of the report has changed. Now the user can clearly see what the most money is being spent for.
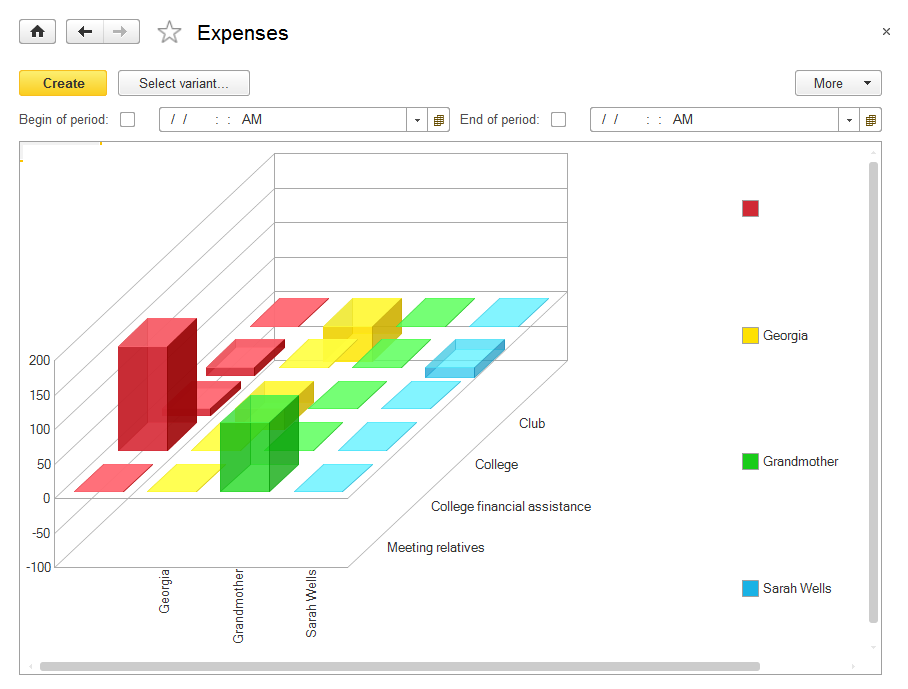
Figure 8-81. The new appearance of the Expenses report
You do not need to change the default settings of the report because the platform provides convenient save and load commands for report variants.
Click More and then click Save variant...
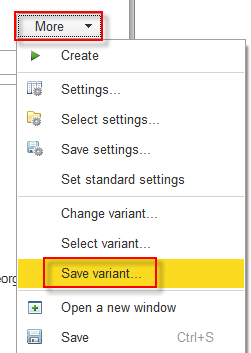
Figure 8-82. Saving the report variant
Input 3D Chart for the name and click Save.
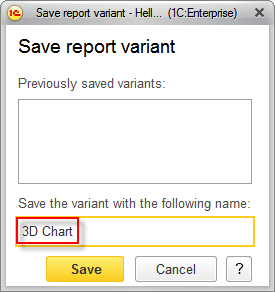
Figure 8-83. Specifying the report variant name
In the future, you will be able to use this variant as many times as it will be necessary. To load the report variant click Select variant...
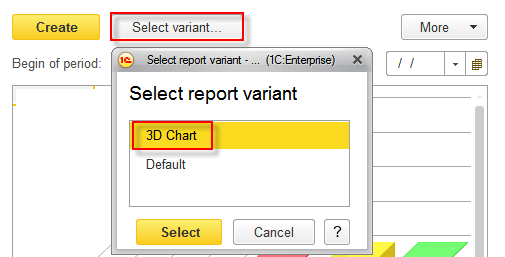
Figure 8-84. Loading the custom report variant
Note that you can always restore the version that was created by the developer in Designer mode because it is listed as Default in the list of report variants.
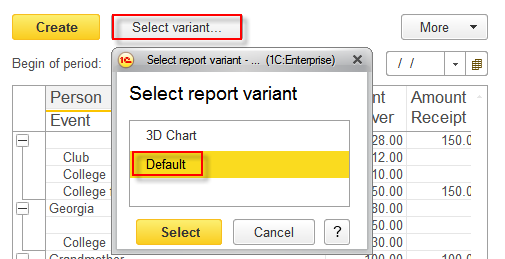
Figure 8-85. Loading the default report variant
Go to the page: Functional options