Let us test the report.
- Start 1C:Enterprise in the debug mode and create the report (fig. 18.42).
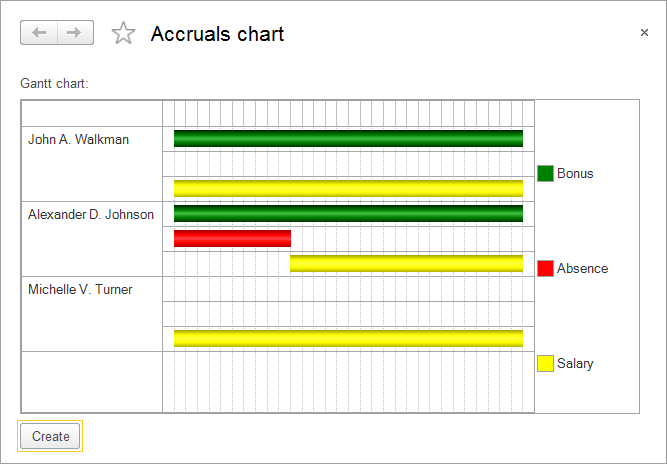
Fig. 18.42. Accruals chart report
Now let us look at how displacement by action period works. - Open the Employee accrual #3 document, and instead of one absence from the 1st through the 10th of September, enter two absences for Johnson: from the 3rd through the 7th and from the 12th through the 15th.
- Repost the document and click the Create button in the report (fig. 18.43).
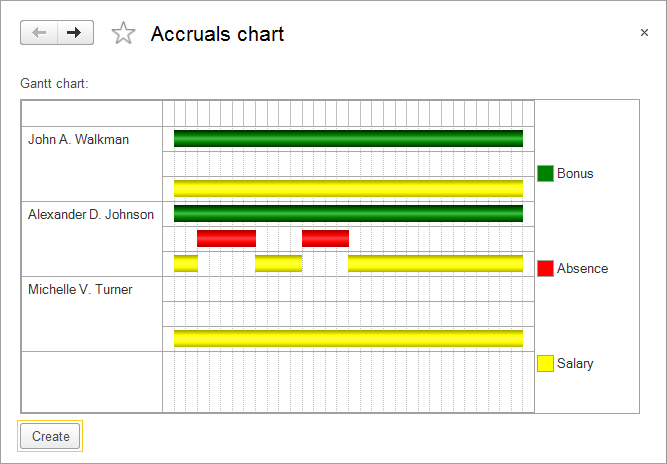
Fig. 18.43. Accruals chart report
You can plainly see how the Absence calculation records displace the Salary calculation record by action period, modifying its actual action period.
Note. You can set up the Gantt chart in 1C:Enterprise mode by right-clicking anywhere in the chart and then clicking Settings. Alternatively, you can specify the chart settings in Designer: in the AccrualsChart report form editor, in the property palette of the form attribute that represents the chart, for the Setup property, click Open. You can specify the following settings using this method: Show title, Show legend, Transparent, and more.