In the data composition system, report items can include groupings, tables, charts, and nested reports.
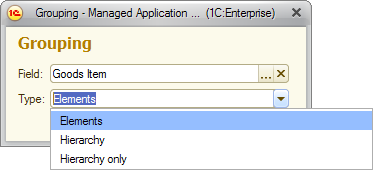
A Grouping displays data as a list. To add a grouping to the report structure, click Add, and then click New Grouping or press Insert. In the window that is opened, select a grouping field and type, as shown in the figure.

Fig. 144. Grouping customization form
To add detailed records to the report, leave the grouping field blank. Detailed records are records obtained from the database and ordered as they are ordered in the database.
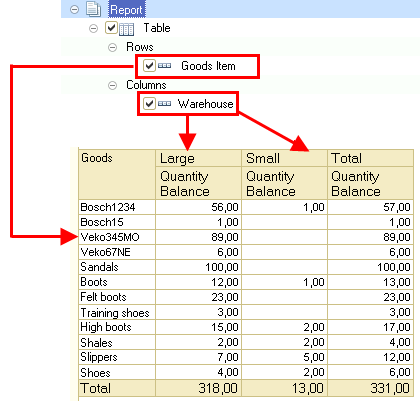
In the simplest scenario, with a grouping by the Goods Item field, the report looks as follows:

Fig. 145. A grouping in a report
Tip. You can select the structure items that you want to be grouped and then, on the All actions menu, click Group.
To remove a grouping but keep its content, click Ungroup.
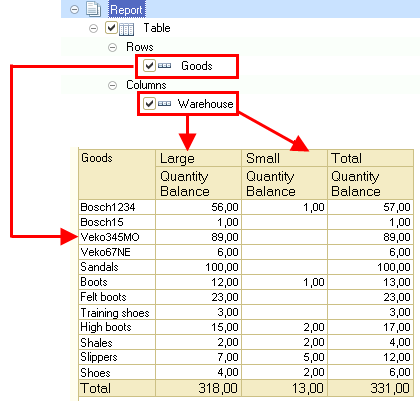
A Table displays data as a table. To add a table to the report structure, click Add, and then click New table. The table rows and columns are defined by groupings.
For example, a report structure can include a table where a list of goods serves as rows, while the columns display inventory balances (see the figure below).

Fig. 146. A table in a report structure
A Chart displays data as a chart. To add a chart to the report structure, click Add, click New chart, and then add points and series, which may vary depending on the chart type. The selected resources are used as chart values.

Fig. 147. A chart in a report structure
If the application design includes a Nested report for the report being edited, you can use the nested report as a report structure item.
Tip. Frequently used report structure customization commands are also available on the context menu of the Report structure field.
To remove an item from a report structure, select it in the structure field and then click Delete or press Delete.
Next page: Customizing report structure items
