Let us add the next report: Revenue by technician.
This report displays the amount of revenue received by Jack of All Trades, Ltd. through the performance of each of its technicians, with a daily breakdown within a selected period and detailed data on the customers served during each of those days (fig. 13.57).
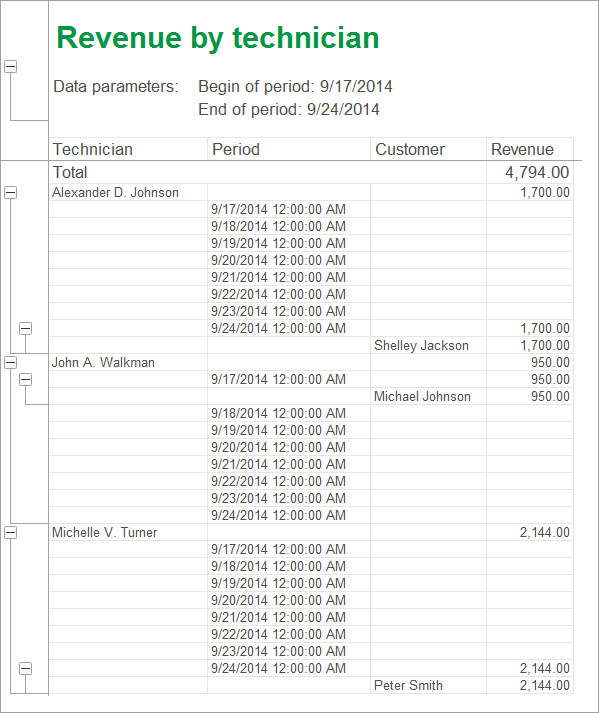
Fig. 13.57. Resulting report
Using this report as an example, we will show how to build multilevel groupings in a query and how to iterate through all the days of the selected period.
We will also show how to set up individual report structure items, export their data into a chart, and create multiple report options in Designer.
Next page: In Designer mode