The report settings wizard provides several relatively simple report customization options. This wizard is convenient when you need to customize a report without going into all the details because you select only the major settings for each report item type.
When you run this wizard, all the previous manual settings may be lost, so you get a warning: Manual settings will be lost. Do you want to continue? To proceed to the wizard, click Yes.
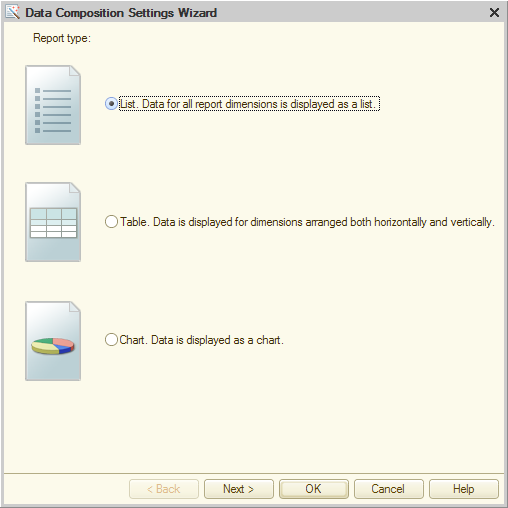
Fig. 231. Data composition settings wizard
Select the report type and click Next. If you do not need to customize the remaining parameters, click OK.
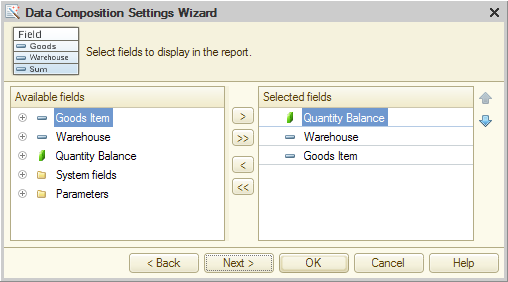
Fig. 232. Selecting report fields
On the field selection page, select the fields that you want displayed in the report. You can use the buttons or drag the fields. You can order the selected fields using the arrow buttons.
To proceed to the next wizard page, click Next.
For Table report type, you can set groupings in rows, columns, or tables. For Chart report type, you can set groupings in series, points, and tables.
In the window that is opened, select the fields and one of the following grouping types:
- Elements. Items only.
- Hierarchy. Both items and folders.
- Hierarchy only. Folders only.
Click Next to select order fields.
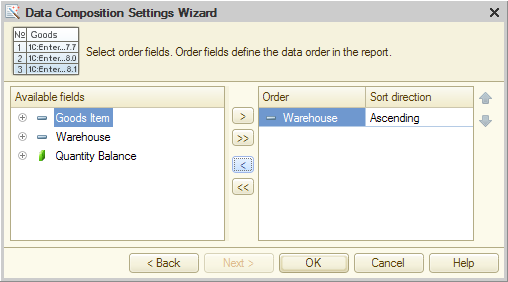
Fig. 233. Selecting order fields
Select the order fields in the same way as grouping fields. For each field, specify the sorting direction.
For List and Table report types, this is the last settings page. For Chart report type, click Next to select the chart type.
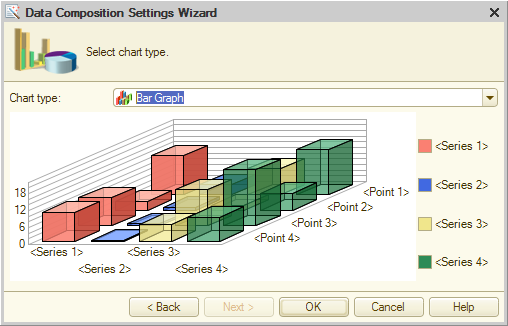
Fig. 234. Selecting a chart in the report settings wizard
Once you complete the data composition settings wizard, the saved settings become available for further editing in the report settings window.
Next page: Customizing reports