The customization consists of defining the topologic objects that will be linked to data, the formats specific to various areas, and their dimensions and positions.
If a geographical schema is embedded into a spreadsheet document, you can import a Geographical schema document from the disk using the Read command from the property palette.
To clear a geographical schema, use the Clear link.
To manage layers of a geographical schema, use the Settings link. This opens the layer settings window.
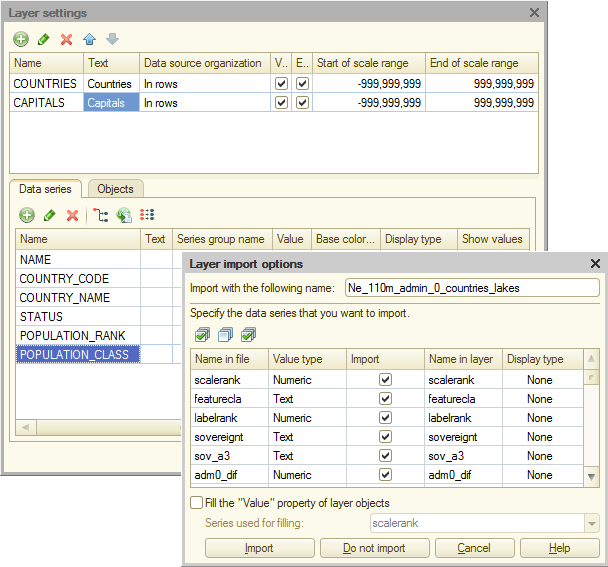
Fig. 280. Geographical schema. Layer settings
Use the toolbar buttons to add, edit, and delete layers.
When you add a layer, a layer selection dialog box opens first, and then a layer import options window (in the figure).
In the window, specify the layer name to be displayed in the schema, the data series to be imported, and data series names and display types.
Each topological object on a geographical schema has a Value property. It stores free-form data that can be used to identify an object.
In the Layer import options window, each object value is filled with some data series value. To import values, select the Fill the "Value" property of layer objects check box and specify the source series.
Once you have selected the layers, you can customize them.
Layer properties include:
- Text. A free-form layer description.
- Data source organization. The data source (if the layer uses a data source). For details, see the section describing the spreadsheet document editor.
- Visibility. Shows whether a layer is displayed.
- Enable selection. Shows whether the interactive selection of layer objects is allowed.
- Start of scale range. The minimum scale at which the layer is displayed.
- End of scale range. The maximum scale at which the layer is displayed.
Series properties include:
- Text. A free-form text describing the series.
- Format. Data display format.
- Display type. Series display type. Series values can be:
- Hidden
- Displayed as text
- Displayed as a histogram
- Displayed as circles where circle sizes depend on values
- Displayed as circles where circle colors depend on values
- Displayed as circles where circle hues depend on values
- Displayed as a pie chart
- Displayed as a picture
- Base color. The color that is used in Histogram mode to display sized circles, hued circles, or pie charts.
- Text color. The text color.
- Text font. The text font.
- Text orientation. The text angle.
Point and multipoint object properties include:
- Drawing style. Shows whether an object is displayed as a marker, a custom character, or a picture.
- Color. The object color (for markers and characters).
- Marker. The marker type.
- Font. The character font.
- Character. The character that represents the object.
- Picture. The picture that represents the object.
- Base point. The point in the picture that is used as the reference point.
Polyline object properties include:
- Color. The line color.
- Line type. The line type.
Polygonal object properties include:
- Color. The fill color.
- Border color. The border color.