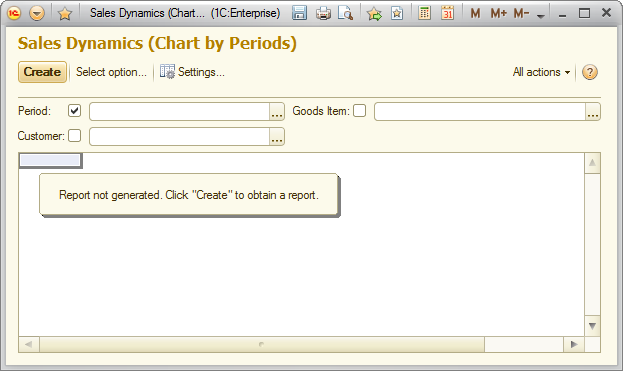
Let us study the report operations on the example of a Sales Dynamics report of the managed application demo configuration. To run the report, use a command on the action panel. This opens the report form.

Fig. 118. "Sales Dynamics" report form
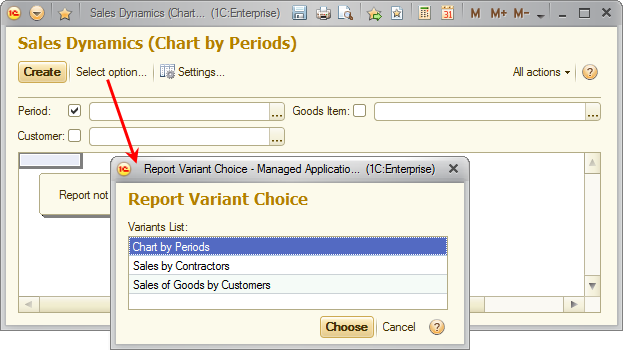
When you open the report for the first time, the Chart by Periods option is selected. To view another option, click Select option and then click the option name.

Fig. 119. Selecting a report option for the "Sales Dynamics" report
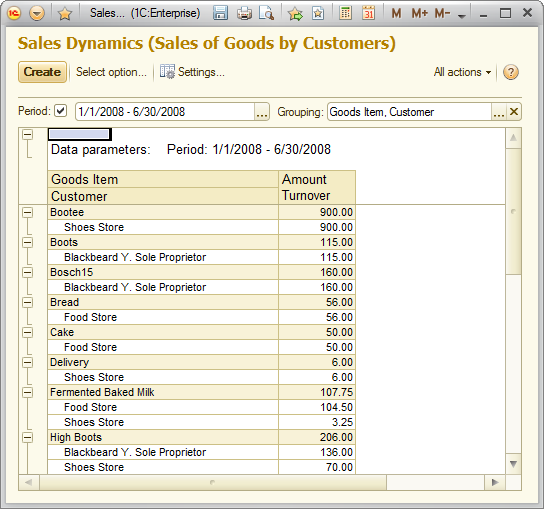
Note that the following settings have been selected for this report option: Period: This year and grouping by Goods Item and Customer fields.
To view the report, click Create.

Fig. 120. "Sales Dynamics" report, "Sales of Goods by Customers" option
Note. If a report contains a single table or grouping, the report header is fixed automatically for viewing convenience. But if the header size exceeds the visible area, it is not fixed.
Next page: Using quick settings
