Let us create the next report: Profit by customer. It visualizes the lifetime profit of Jack of All Trades by customer (fig. 13.99).
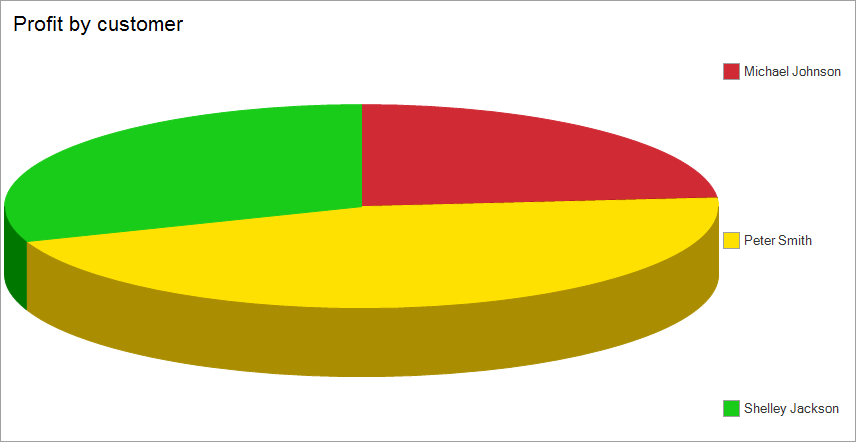
Fig. 13.99. Resulting report
Using this report as an example, we will show how to use calculated fields and how to display a report as a pie chart and as a bar chart.
Next page: In Designer mode