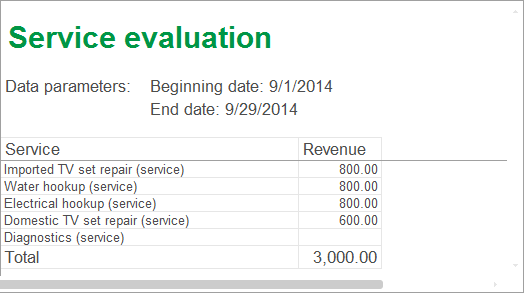
The Service evaluation report displays the most profitable services for Jack of All Trades within a given period (fig. 13.18).

Fig. 13.18. Resulting report
Using this report as an example, we will show how to select data within a given period, how to set query parameters, how to use data from multiple tables in a query, and how to include all the data from a single source to the query result.
You will also learn how to work with data composition system parameters and how to use default dates, and you will familiarize yourself with quick user report settings.
Finally, you will learn more about the report filter and conditional appearance settings.
Next page: In Designer mode

