The Chart object is intended for displaying charts and diagrams in spreadsheets and forms.
Generally speaking, a chart consists of points, series, and series values in those points (fig. 13.76).
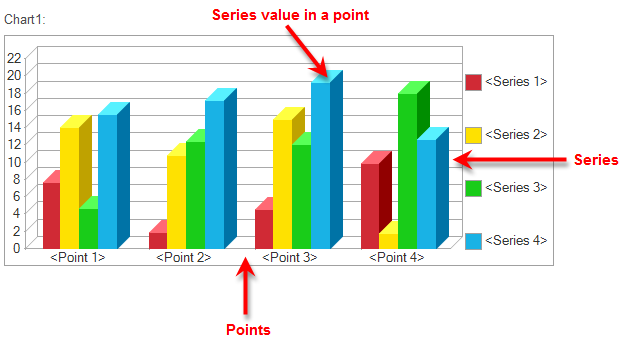
Fig. 13.76. Sample chart
As a rule, points represent moments of time or objects that have characteristics whose values you obtain, while series represent the characteristics. Chart values are located at intersections of series and points.
For example, a chart depicting monthly sales for service types consists of points (months), series (service types), and values (sales revenues).
The Chart 1C:Enterprise script object has three areas that define the chart appearance: the plot area, the header area, and the legend area (fig. 13.77).
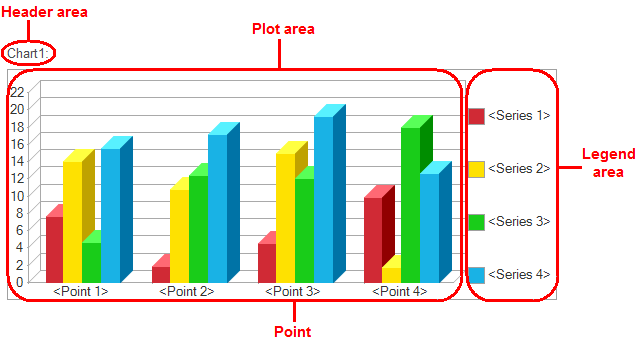
Fig. 13.77. Chart areas
You can add a chart as an independent report structure item. In the RevenueByTechnician report option you will include a chart in the data composition schema settings structure.
Next page: In Designer mode