The Debugger tool comes handy when you write a custom script. While the Syntax Assistant requires you to understand the execution context, the object structure, and more, Debugger requires none of these.
You can simply stop at any point in your program and view the available properties or script objects.
Debugger is a tool that facilitates the development and debugging of 1C:Enterprise modules. It provides the following capabilities:
- Step-by-step module execution
- Setting breakpoints
- Pausing and resuming module execution
- Debugging multiple modules simultaneously
- Calculating expressions to analyze variable states
- Viewing procedure and function call stack
- Pausing upon error
- Editing modules during the debugging
For now, we will not discuss all these features in detail but will instead discuss Debugger use cases on the example of the MaterialsQuantityOnChange event handler (listing 4.1).
When you are editing module script in Designer, the commands of the Debug menu that set and clear breakpoints are available. The script execution is paused at lines that have breakpoints. During a pause you can analyze the current values and types of module expressions and variables and continue the execution up to the next breakpoint, and so on.
- Open the GoodsReceipt document form, click the Module tab, and look at the MaterialsQuantityOnChange procedure.
Note that the commands for breakpoint operations are now available in the Debug menu and on the Designer mode toolbar (fig. 5.36).

Fig. 5.36. Breakpoints toolbar
To set a breakpoint- Double-click on the vertical bar to the left of the script line.
-OR-
Move the cursor to the module line and then, on the Debug menu, click Breakpoint.
-OR-
Click the Breakpoint button on the toolbar.
This adds a breakpoint icon to the left of the script line.
- Double-click the breakpoint icon to the left of the script line.
-OR-
Move the cursor to the script line with the breakpoint and then, on the Debug menu, click Breakpoint.
-OR-
Click the Breakpoint button on the toolbar.
- On the Debug menu, click Clear all breakpoints.
-OR-
Click the Clear all breakpoints button on the toolbar.
- Double-click on the vertical bar to the left of the script line.
- Double-click on the vertical bar to the left of the first line of the MaterialsQuantityOnChange procedure (fig. 5.37).
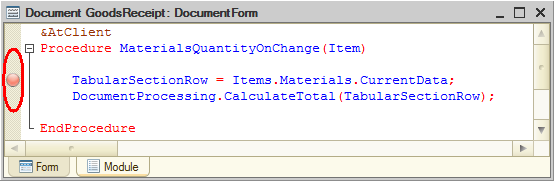
Fig. 5.37. Setting a breakpoint in the MaterialsQuantityOnChange procedure
To debug a 1C:Enterprise script algorithm, you have to run the application that executes that algorithm in the debug mode. - On the Debug menu, click Start debugging.
-OR-
Click the Start debugging button on the toolbar.
The designer starts 1C:Enterprise in the debug mode. Actually, this is exactly what you have done before but you have not set any breakpoints and the applied solution execution was never paused. - Open the list of Goods receipt documents and open any of the two documents that you created.
- Edit the Quantity field in any document row.
Once you do it, the program execution is interrupted and the MaterialsQuantityOnChange procedure is opened in Designer at the breakpoint location. An arrow over the breakpoint icon indicates the module line that is being executed (fig. 5.38).
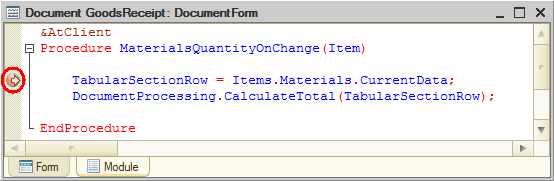
Fig. 5.38. Pausing a program at a breakpoint
Note that the commands for debugging the configuration are now available in the Debug menu and on the Designer mode toolbar (fig. 5.39).

Fig. 5.39. Configuration debugging toolbar
The Step Over, Step In and Step Out buttons continue step-by-step script execution.
The Continue Debugging button continues debugging up to the next breakpoint.
The Immediate Window and Evaluate expression buttons are intended for viewing expression values at the current breakpoint.
The Call Stack button is intended for tracing the sequence of procedure and function calls.
But for now, the program is already paused at the specified line of the MaterialsQuantityOnChange procedure. Note that this line has not been executed yet so the variable values are not assigned yet. You can use the Step Over button to view their values after the line is executed.
Let us look at the Items.Materials.CurrentData expression and view the content of that object at the current breakpoint. - Double-click the Items word and then click the Evaluate expression button
 (Shift+F9) on the configuration debugging toolbar.
The Items value is added to the Expression field. The Value and Type columns display the value and type of this object. You can see that the Items object is a FormAllItems value collection, which stores all of the form controls. Expand this object branch (fig. 5.40).
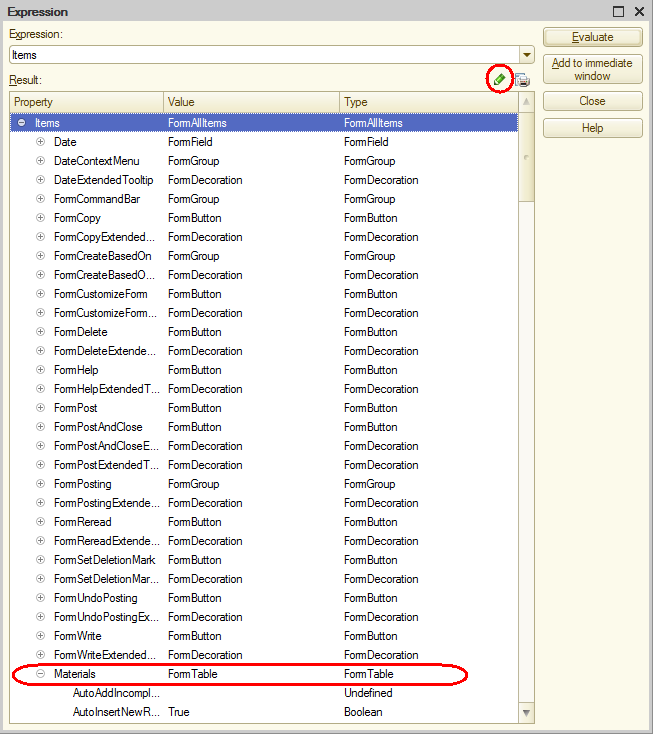
Fig. 5.40. The Items object
Above the Result pane you can see the Show Values in Separate Window button. If you click this button (or press F2), you will be able to view the collection contents.
Next, let us check the Materials expression. - Find Materials in the list of form controls.
You can see that it is a FormTable object. Expand this object and review its properties. The property we are interested in is CurrentData. - Find the CurrentData branch and expand it.
You can see the data stored in the current tabular section row, with values and types. Note that Quantity has the value that you have just set (fig. 5.41).
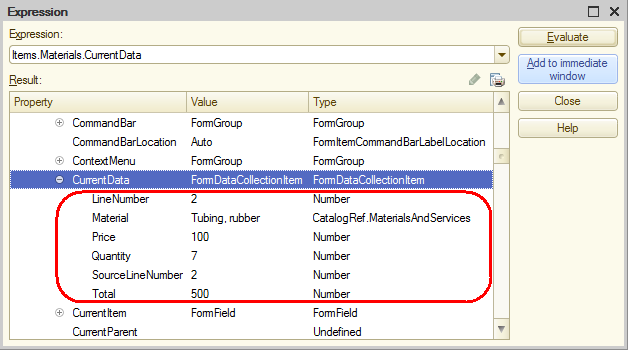
Fig. 5.41. Items.Materials.CurrentData object - Close the Expression window.
Then let us step to the procedure of the common DocumentProcessing module where the TabularSectionRow value is calculated. - Click Step In on the configuration debugging toolbar twice. This program execution is now paused at the CalculateTotal procedure of the common DocumentProcessing module.
- Double-click TabularSectionRow to select it and then click Evaluate expression.
- Expand the TabularSectionRow object (fig. 5.42).
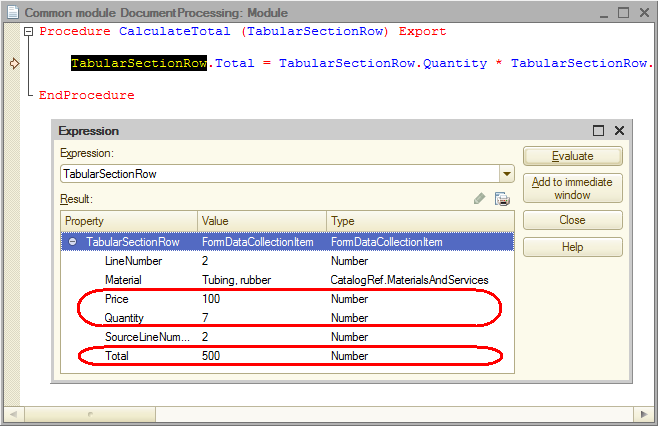
Fig. 5.42. The TabularSectionRow object
You can see that the TabularSectionRow variable contains a FormDataCollectionItem object. But the values in the Total column are not recalculated because the second line has not been executed yet. - Close the Expression window and click the Step In button on the configuration debugging toolbar.
The platform executes the CalculateTotal procedure of the common DocumentProcessing module and pauses at the end of the procedure. - Move the pointer over the Quantity or Total word to view a tooltip with its current value (fig. 5.43).
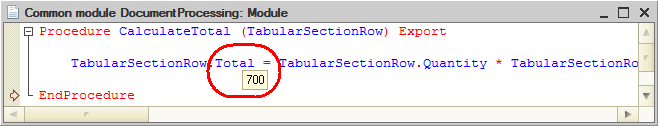
Fig. 5.43. The TabularSectionRow object
You can see that the values in the Total column are recalculated, so the Items.Materials.CurrentData object now contains new values.
After you analyze the variables and expressions, you can continue with debugging.
To continue debugging
- Click the Continue Debugging button.
To stop debugging
- On the Debug menu, click Stop.
Note that you can set a breakpoint inside a loop and see how values are changed during each iteration.
You can edit the configuration and save the changes during the debugging.
Important! Although you can edit a module that is being debugged, Debugger does not compile the modified script, and debugging is continued for the database configuration script (the script that was available at the moment when Debugger was started or when the connection was opened). To debug the changes that you made, you have to update the database configuration first.
Finally, let us discuss some handy debugging techniques.
When you are in a form module and you want to write a handler, you can use the ThisObject property to view the context properties of the current form along with its available extensions and other available items.
To view ThisObject property
- After you stop at a breakpoint, click the Evaluate expression button (Shift+F9) on the configuration debugging toolbar.
- In the Expression field, enter ThisObject and click Evaluate (fig. 5.44).
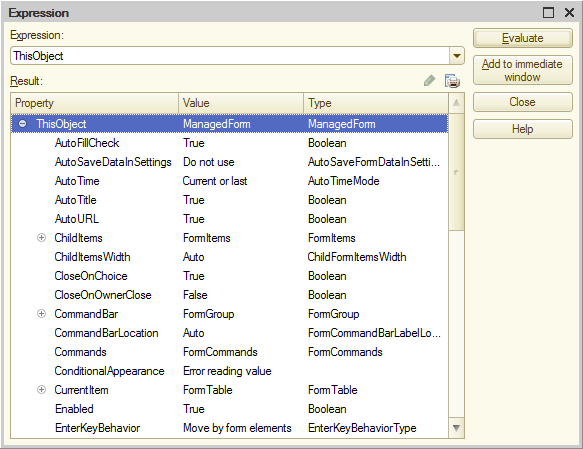
Fig. 5.44. ThisObject property of a managed form
If you expand this item, you will see the type and properties of the 1C:Enterprise script objects available at the current breakpoint.
And when you are in an object or recordset module, you can use ThisObject property in a similar manner to view the properties of the object or recordset module context.
Next page: Objects, objects, objects