When you move the pointer over a report cell that can be drilled down, the pointer changes (see the figure). Double-clicking that cell opens the cell value in a new window while double-clicking a cell with resources prompts you to select a field for drilling down and then displays the result.
Right-clicking the cell displays its drill-down menu.
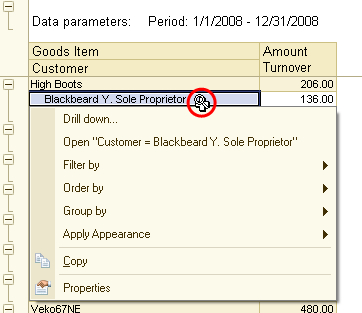
Fig. 132. A drill-down menu of a report cell
Drill down displays detailed information about the field value. All the details are displayed in a new window.
For example, to find out when high boots were sold, you can create a Sales Dynamics report, click the High Boots cell, run the Drill down command, and then, in the field selection window, select Period.
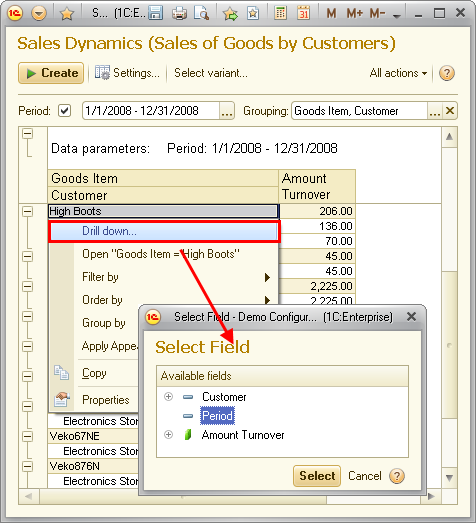
Fig. 133. Selecting a drill-down field
Once you click Select, the details are displayed in a new window.
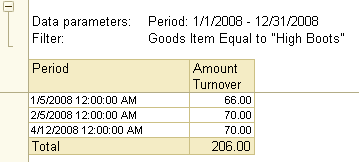
Fig. 134. A drill-down result
The Open "…" command opens a form for viewing data displayed in the cell. For example, a list item form.
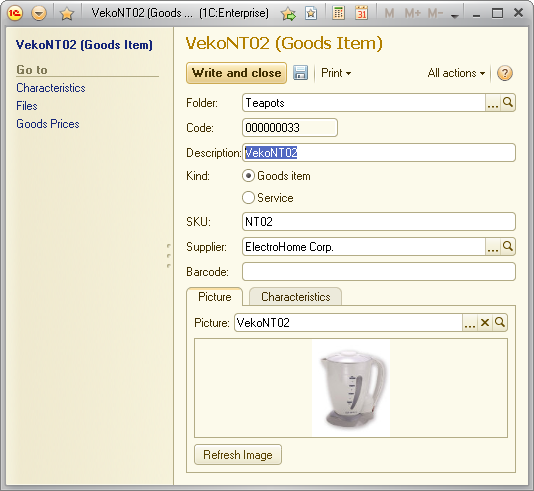
Fig. 135. A list item form
The Filter by command filters the current report structure item by the value of the selected field. To set a filter by another field, point to Filter by, click Other field, and specify a filter condition. For example, you can filter the report to display only rows with Amount (Turnover) over 50 000.
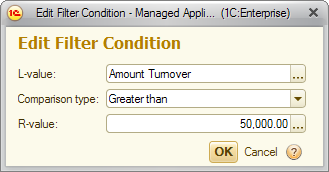
Fig. 136. The "Edit filter condition" dialog box
The result is displayed in a new window.
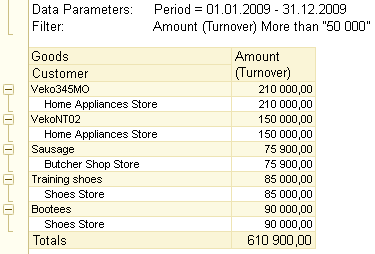
Fig. 137. A result or filtering
The Order by command orders the current report structure item by the value of the selected field. To order by another field, point to Order by, click Other field, and specify a field. For example, you can order a report by the Goods Item field.
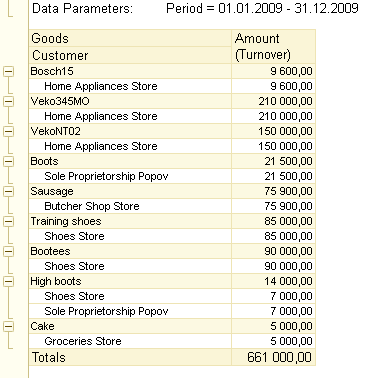
Fig. 138. A result of report ordering
The Group by command sets a grouping by the value of the selected field for the current report structure item. For example, in the Inventory Balance report, to find out which goods are available in each warehouse, apply to group by Warehouse field.
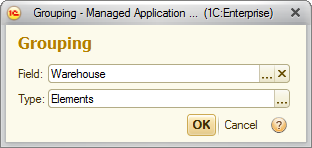
Fig. 139. Selecting a grouping field
The resulting report looks as follows:
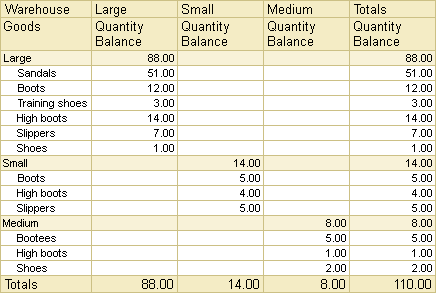
Fig. 140. A result of report grouping
The Apply Appearance command sets conditional appearance for the current report structure item. For example, you can highlight the fields where Quantity Balance < 10 items.
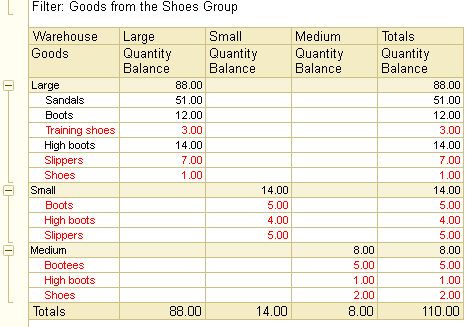
Fig. 141. Report appearance example
The next chapter: Chapter 9. Report options