The next step in the development of the applied solution will be the creation of convenient reports on activities. Reports as well will be created without any programming, using only visual design tools.
Reports are located in the Reports branch of the Configuration object tree. Let us add a new report.
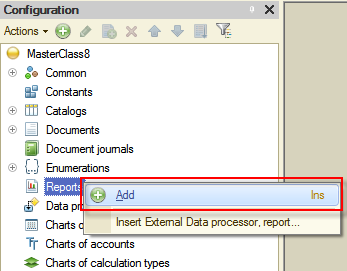
Figure 7-1. Creating a new report
Name the new report Expenses and then click Open data composition schema of this report.
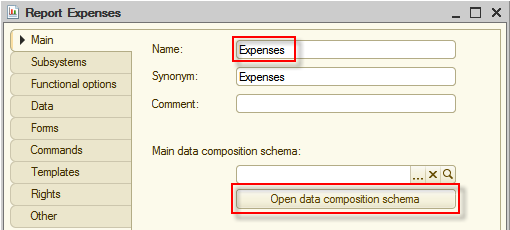
Figure 7-2. Opening the data composition schema of the Expenses report
Since this is a new report, it does not contain any data composition schema, the platform will open Template Wizard and suggest you create a new template. That template will contain a data composition schema. Agree by clicking Finish.
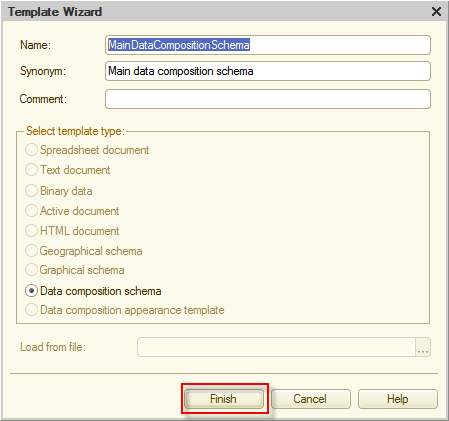
Figure 7-3. Template Wizard
After that, the platform will open the Data composition schema editor. For now, this composition schema is empty.
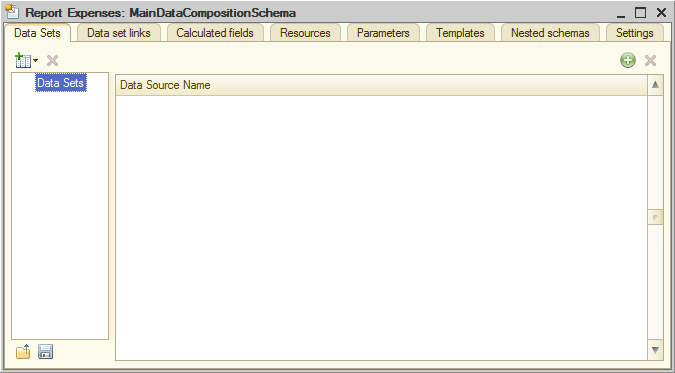
Figure 7-4. The empty data composition schema
Now you will define sources of data that the report will use to retrieve data and define the structure of the report.
Add a Data set of type Query. In other words, the data for this report will be retrieved from the database, managed by 1C:Enterprise.
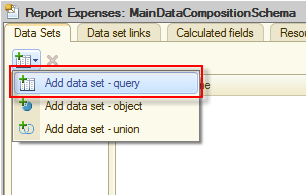
Figure 7-5. Creating a new query
You can enter a query manually or use Query builder. Let us use the second way, for that click Query Builder…
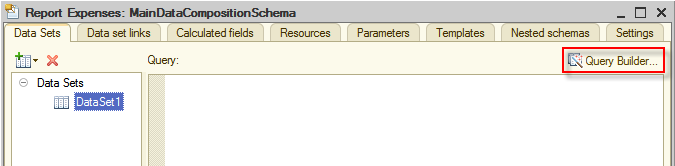
Figure 7-6. Opening Query builder
In the Query builder window on the left, there is a list of tables that can be used for retrieving data. Expand the AccumulationRegisters branch and double-click to select FinancialTransactions.BalanceAndTurnovers table.
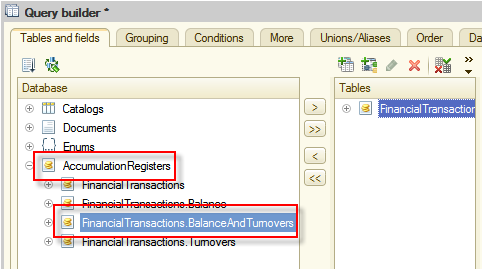
Figure 7-7. Selecting the FinancialTransactions.BalanceAndTurnovers table
In the Tables panel that is in the middle, select the FinancialTransactionsBalanceAndTurnovers table and click Add all fields  . All fields of this table will be selected as query fields.
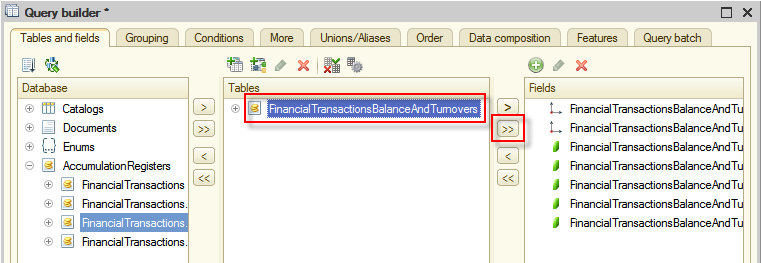
Figure 7-8. Selecting data for query
The query is configured, click OK.
The wizard will generate the query text and automatically populate fields of the data composition schema.
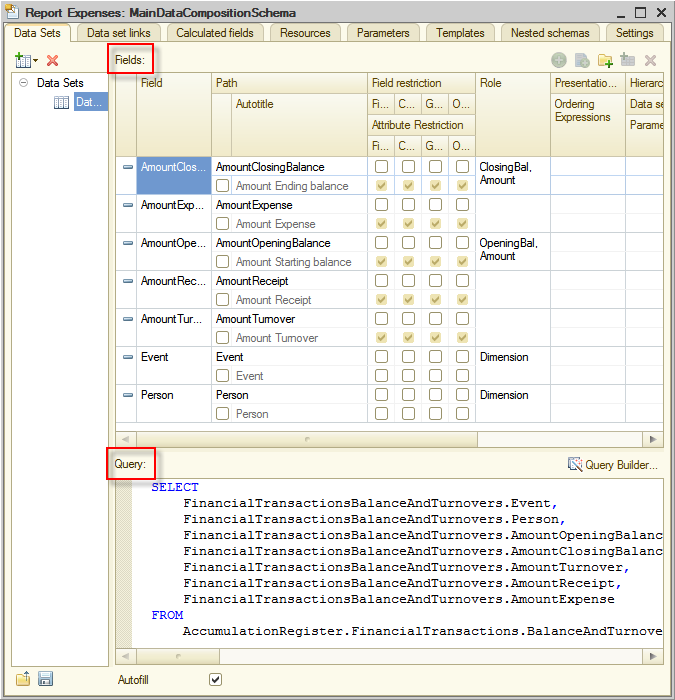
Figure 7-9. Data composition schema fields
Click the Resources tab. Here, using double-clicks select the following fields:
- AmountClosingBalance
- AmountOpeningBalance
- AmountTurnover
- AmountReceipt
- AmountExpense
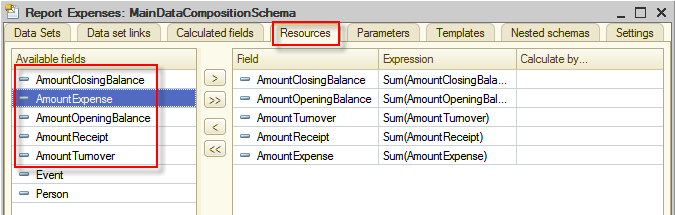
Figure 7-10. Data composition schema resources
Click the Settings tab. Here, in order to create the structure of the report, you will use another wizard. To do this, click Open settings wizard  .
.
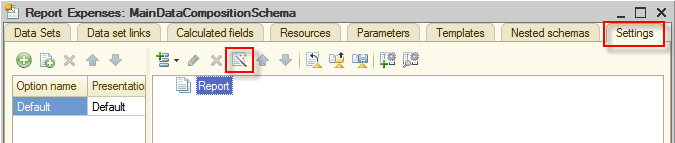
Figure 7-11. Opening Data Composition Settings Wizard
Data Composition Settings Wizard allows you to quickly create several simple variants of the report. For this tutorial purposes, List is a good choice. Therefore, do not change anything, and just click Next.
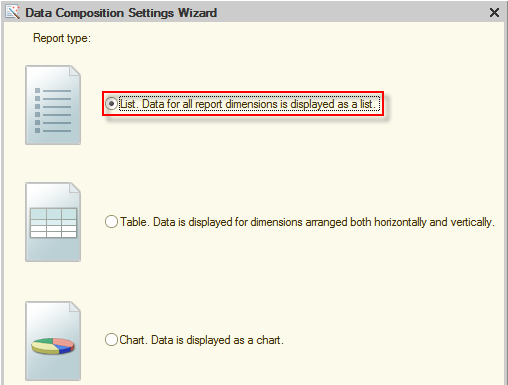
Figure 7-12. Creating a report in the form of list
On the next step, select fields that will be displayed in the report. Double-click the following fields in Available fields list:
- Person
- Event
- AmountTurnover
- AmountReceipt
- AmountExpense
Then click Next.
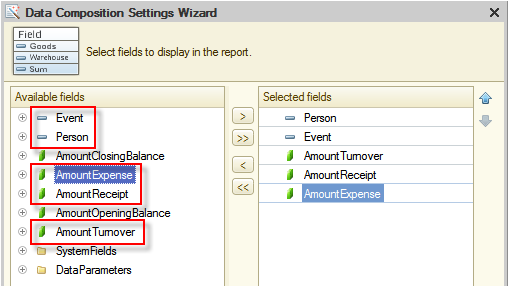
Figure 7-13. Selecting report fields
Now we need to select fields that will group the data in the report. Users would like to see reports on each acquaintance, and on each event associated with the acquaintance. To achieve this, the list of available fields double-click on both Person and Event fields to select them as grouping fields.
After that, click OK. You are now done with defining the structure of the report.
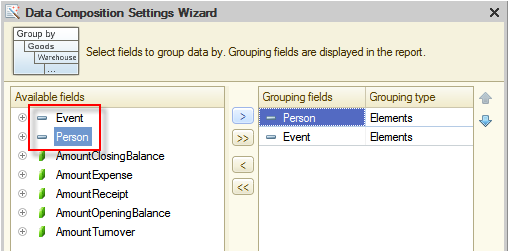
Figure 7-14. Selecting group fields of the report
The platform will now show the structure of the report.
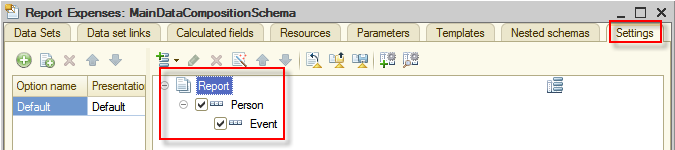
Figure 7-15. Completed structure of the report
It is almost done. Now, give a user an ability to arbitrarily set the report period. This will be useful when the register will contain a large amount of records accumulated after a long period of using this application. This is easy to do as under the structure of the report, there are two parameters available, named Begin of period and End of period.
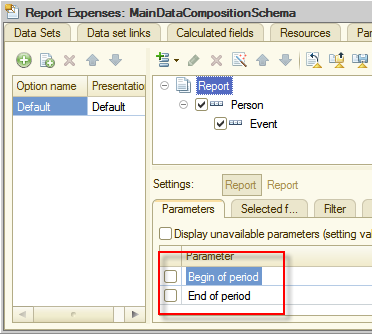
Figure 7-16. Report parameters
Right-click each of the parameters and then select Custom settings item property.
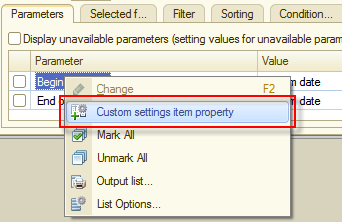
Figure 7-17. Opening Custom settings item property
In the opened window, select the Include in custom settings check box and click OK.
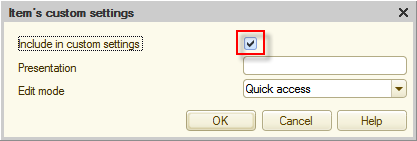
Figure 7-18. Include in custom settings
After repeating this procedure for both Begin of period and End of period parameters, continue configuring the report. To do this, close the data composition schema editor and return to Expenses report editor. Click the Subsystems tab and include this report in the Finances subsystem.
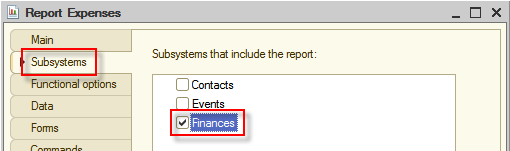
Figure 7-19 Including Expenses report in the Finances subsystem
Start the application in 1C:Enterprise mode and take a look at the report. Notice that this report is located in the Finances section. Also, notice that the platform automatically placed the report in the Reports menu group.
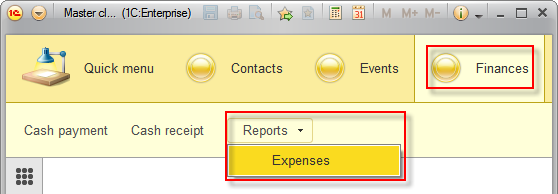
Figure 7-20. Opening Expenses report
After the report is opened, click Create.
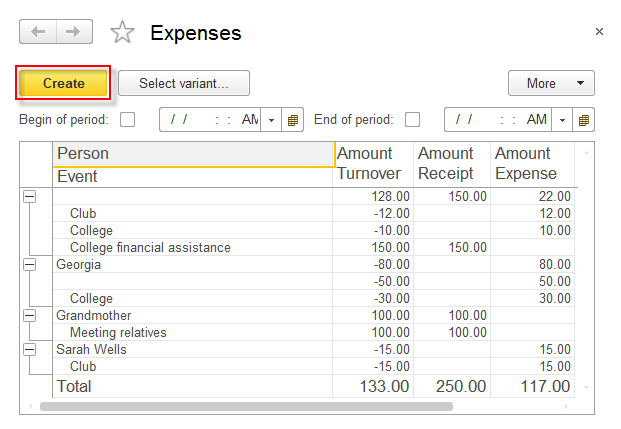
Figure 7-21. The Expenses report
Having confirmed that the report works properly and displays records of the Cash receipt and the Cash expense documents according to dimensions that were defined for the register, return to Designer mode.
Create one more simple report that can show the current balance of available funds. Name it CashBalance and include it in the Finances subsystem. Similarly, to the Expenses report, click Open data composition schema for the Cash balance report on the Main tab and create the data composition schema. Add the data set of the Query type on the Data sets tab.
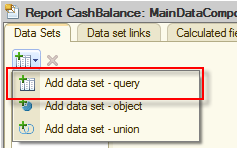
Figure 7-22. Adding the query for the Cash balance report
In the opened window, use Query builder as previously. However, for the new report, select the FinancialTransactions.Balance table.
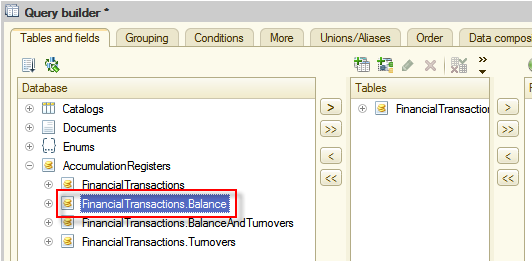
Figure 7-23. Selecting tables for the Cash balance report
Next, expand FinancialTransactionsBalance in the middle panel, click the AmountBalance field, and then double-click or click Add selected  to select it.
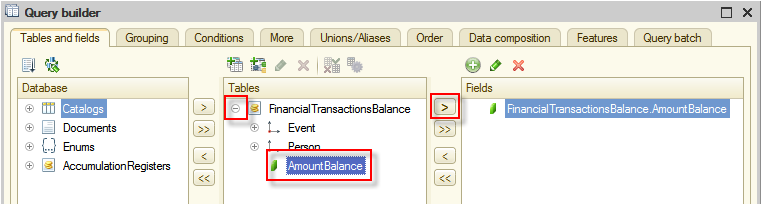
Figure 7-24. Selecting the AmountBalance field
Click OK to close Query builder. After this, again you will see the Data Sets tab of the data composition schema editor. No changes need to be made here. Click the Resources tab, then double-click the AmountBalance resource.
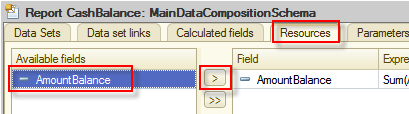
Figure 7-25. Selecting the AmountBalance resource
Open the Settings tab. Here, use the Data Composition Settings Wizard once again, confirming the default type, List.
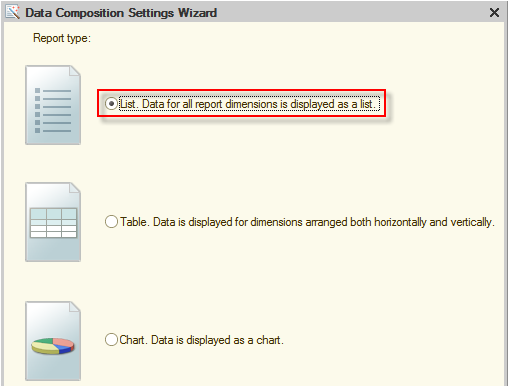
Figure 7-26. Data Composition Settings Wizard
On the next page, double-click the Period standard field in the DataParameters group. This field will allow seeing the date, which the report is created for. Then add the AmountBalance field.
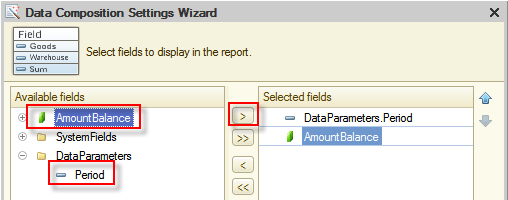
Figure 7-27. Selecting report fields
After selecting fields, click OK because there is nothing else that this report is required to display. The next thing to do is to include the Period parameter to Custom settings as you did when configuring the Expenses report.
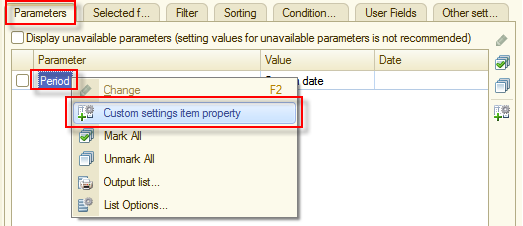
Figure 7-28. Including Period to Custom settings
Set the default value of the Period parameter to Beginning of this day so that the report will automatically display the information for the current day.

Figure 7-30. Selecting Beginning of this day as the default value of the Period parameter
After that changes, the report settings will look as follows:
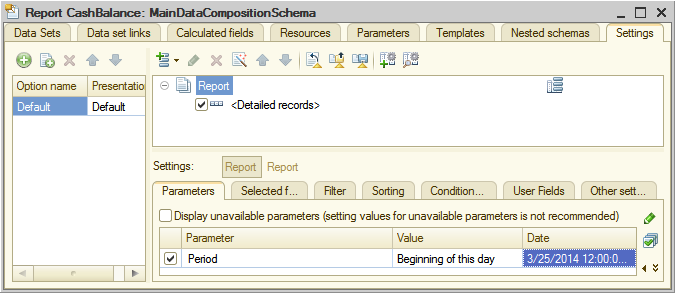
Figure 7-30. Settings of the Cash balance report
Now start the application in 1C:Enterprise mode and check the report.
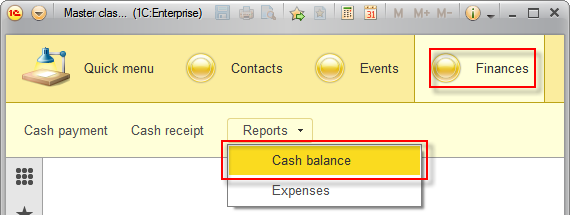
Figure 7-31. Opening the Cash balance report in 1C:Enterprise mode
Information presented in the report is extremely simple but useful. Now the user can always check how much money is available now.
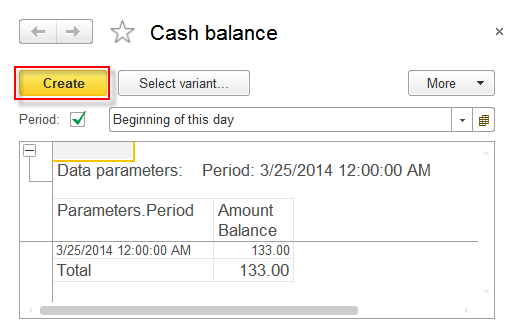
Figure 7-32. The data of the Cash balance report
Excellent! Now, create another report. After this report will be finished the CRM application will be complete.
Return to Designer mode, create a new report, and name it DailyChart, then include it in the Finances subsystem, and finally click Open data composition schema. Add the Data set of the Query type, and then open Query builder.
In the left panel select the FinancialTransactions.BalanceAndTurnovers table. Up to this point, the process has no difference from what you did during configuring the Expenses report.
Seeing that the report is named Daily chart you might have guessed that a new report will display not numeric data but a chart. And now the trick. To present the data from the register in the suitable for this report format, select FinancialTransactionsBalanceAndTurnovers table in the middle panel of Query builder and click Virtual table parameters  .
.
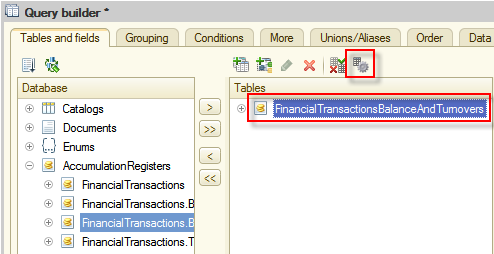
Figure 7-33. Opening Virtual table parameters
In the opened window, in the Periodicity field, select Day and then click OK to save and close the window.
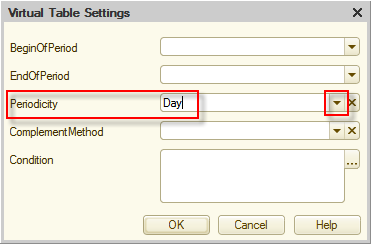
Figure 7-34. Adjusting Virtual table parameters
Then, in the middle panel, select the Period and the AmountClosingBalance fields from the FinancialTransactionsBalanceAndTurnovers table.
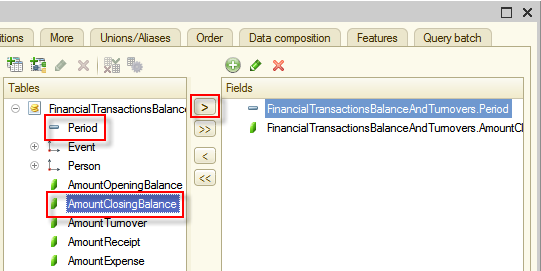
Figure 7-35. The Period and the AmountClosingBalance fields
Click OK to close Query builder. Then, click the Resources tab and select the AmountClosingBalance field as a resource.
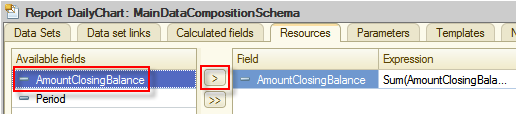
Figure 7-36. The Resources tab of the Daily chart report
Click the Settings tab and open Data Composition Settings Wizard. This time, click Chart. Data is displayed as a chart and then click Next.
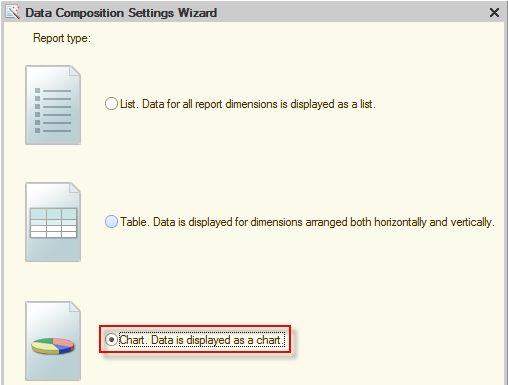
Figure 7-37. The Chart report type
After adding Period and AmountClosingBalance to selected fields, click Next.
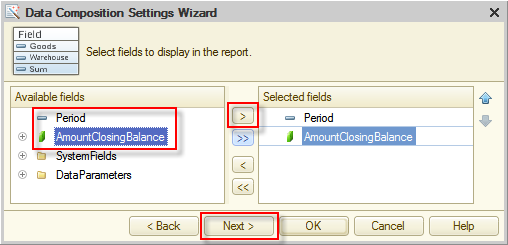
Figure 7-38. Adding chart fields
On the next page, add the Period field to the list in the Points panel on the right side. Click Next.
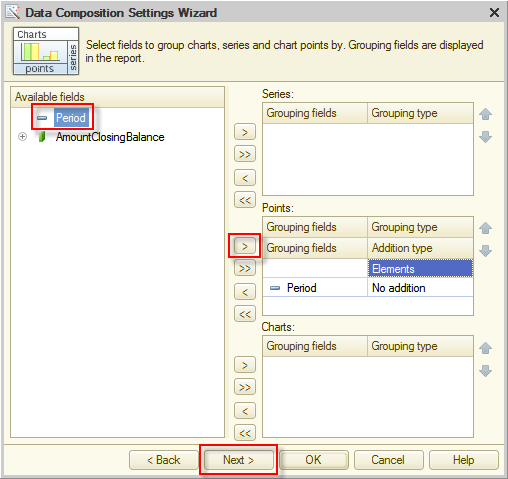
Figure 7-39. Configuring Points of the chart
On the next page, add Period to order fields on the right panel. Click Next.
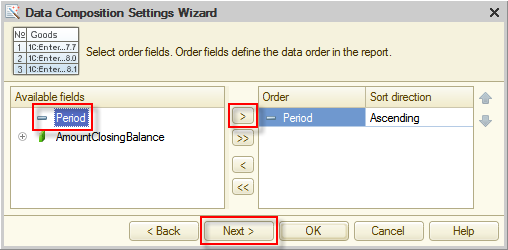
Figure 7-40. Data order fields of the chart
On the next page, in the Chart type field select Line. At this point, the design of the chart complete, and you can click OK.

Figure 7-41. Chart types
In the same way, as you did for previous reports, including the Begin of period and the End of period parameters in Custom settings using Custom settings item property.
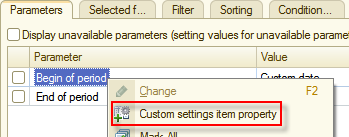
Figure 7-42. Adding properties to custom settings
Now you can see what you have created. Start the application in 1C:Enterprise mode, open the Daily chart report and then click Create.
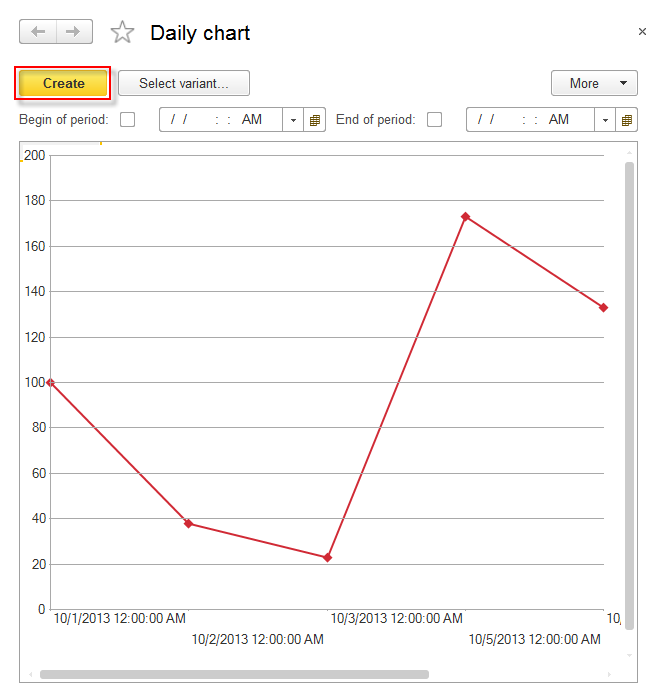
Figure 7-43. The Daily chart report
From this chart, users can clearly see the changes in the balance of money, made by Cash receipts and Cash expenses.
Go to the page: Improving the interface