Let us check the report.
- Run 1C:Enterprise in the debug mode.
- In the Accounting section, on the Reports menu, click Profit by customer.
- Click Create.
You can see that the profit generated by rendering services to specific clients is displayed as a pie chart (fig. 13.106).
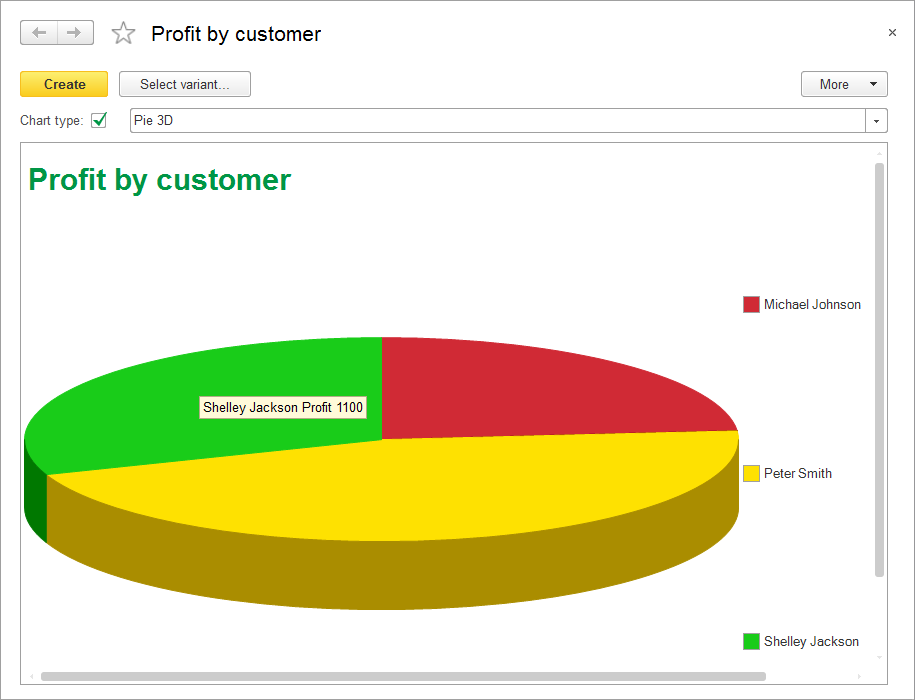
Fig. 13.106. 3D pie chart - In the report form, change Chart type to Column 3D and create the report.
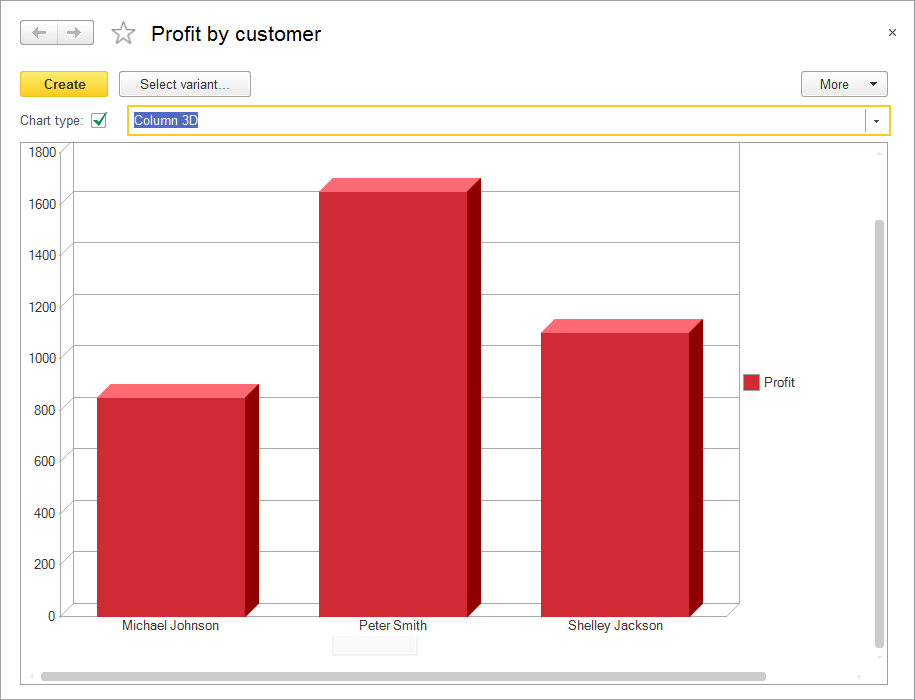
Fig. 13.107. 3D column report
So we have shown how you can use various chart types for viewing report data.
Next page: Displaying data as a spreadsheet