You can configure a chart to display spreadsheet document data.
Suppose that a spreadsheet document contains data.
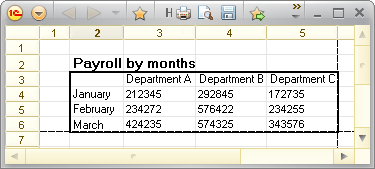
Fig. 260. A spreadsheet document. Chart data area
To create a histogram based on this data:
- Select a cell range that contains data (marked with a border in this example).
- On the main menu, point to Table, point to Pictures, and click Chart.
- Select an area for drawing a chart.
This adds a chart that displays the specified data in graphical form. You can customize the chart appearance, title, area sizes, colors, and many other parameters using the chart property palette.
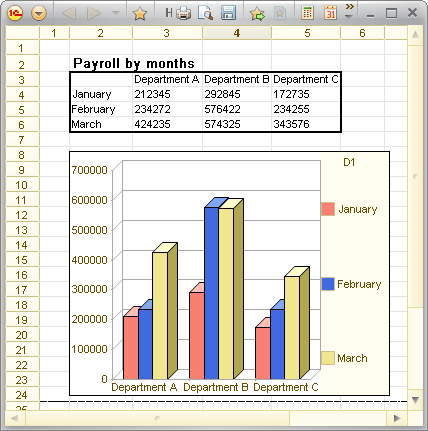
Fig. 261. A spreadsheet document. Adding a chart
To customize a chart, on the main menu, point to Edit and click Properties.
Next page: Managing OLE objects